Second-warmest spring on record for the contiguous U.S.

Key Takeaways:
- Widespread spring warmth: More than half of the states experienced a spring (March–May) that ranked among their three warmest in the 132-year record, with Arizona, New Mexico, Colorado and Texas each recording their warmest spring on record. Meanwhile, Ohio, West Virginia and Pennsylvania each ranked in the coldest third of their records for May.
- Dry start to the year: Despite regions of above-average precipitation, the contiguous U.S. (CONUS) recorded its sixth-driest January–May on record and its driest since 1988.
- Drought remained widespread: Although drought conditions improved across parts of the South, more than half of the CONUS remained in drought at the beginning of June.
- Hawaiʻi experienced its wettest spring: The island chain observed its wettest spring in the 36-year record, receiving more than double its average spring precipitation.
- Cold spring in Alaska: Alaska experienced its coldest spring since 2013, at 2.2°F below its 1925–2000 average, contrasting with the widespread warmth across the CONUS.

Other Highlights:
Temperature
The CONUS average temperature during May was 61.7°F, 1.5°F above the 20th-century average, ranking in the warmest third of the 132-year record. Much of the western third of the CONUS experienced above-average temperatures, with portions of the Northwest recording much-above-average warmth. In contrast, areas east of the Plains saw mostly near- or below-average temperatures, with the notable exception of the southern Florida Peninsula, which experienced one of its warmest Mays on record. Statewide, Oregon tied its fifth-warmest May and Washington ranked seventh warmest, while Florida tied its sixth-warmest May on record. Ohio, West Virginia and Pennsylvania each ranked in the coldest third of their records for May.

For meteorological spring (March–May), the average temperature across the CONUS was 55.8°F, 4.9°F above the 20th-century average, ranking as the second-warmest spring on record and the warmest since 2012. Except for portions of the northern tier, most of the CONUS experienced much-above-average spring temperatures. All CONUS states experienced above-average temperatures, including 20 states that averaged at least 5°F above their 20th-century mean. Arizona, New Mexico, Colorado and Texas each recorded their warmest spring on record, with Arizona and New Mexico exceeding their previous records by more than 1°F.
Across Alaska, the average temperature in May was 38.4°F, 0.6°F above the 1925–2000 average, ranking in the middle third of the 102-year record. For spring as a whole, Alaska’s average temperature was 21.8°F, 2.2°F below average, ranking in the coolest third of the record and the coldest spring since 2013.
Hawaiʻi's average temperature for May was 66.5°F, 0.3°F above the 1991–2020 average, ranking in the middle third of the 36-year record. For spring, Hawaiʻi tied its third-warmest spring on record with an average temperature of 65.9°F, 1.1°F above average. The island chain also recorded its warmest average spring minimum temperature on record, at 2.3°F above average.
Precipitation
Total precipitation averaged across the CONUS during May was 2.86 inches, 0.05 inch below the 20th-century average, ranking in the middle third of the 132-year record. The month was characterized by drier-than-average conditions across much of the interior West and Rockies, as well as portions of the Plains, Upper Midwest and Great Lakes. In contrast, above-average precipitation fell across portions of the Gulf Coast, Deep South, Southeast, Ohio Valley and Northeast. Statewide, Idaho, Minnesota, Wisconsin and Michigan each received about half of their average May precipitation and ranked among their 10 driest Mays on record. Meanwhile, several southern states, including Louisiana, Mississippi, Alabama and Georgia, received more than 160% of their average May precipitation.

For spring (March–May), the CONUS precipitation total was 7.43 inches, 0.50 inch below average, ranking in the driest third of the 132-year record. Despite the deficits observed in May, parts of the Midwest and Great Lakes recorded much-above-average spring precipitation, with Michigan experiencing its wettest spring on record. In contrast, much of the West, Southwest and Rockies, along with western portions of the Plains, experienced a particularly dry spring. Parts of the Southeast and Mid-Atlantic also recorded much-below-average March–May precipitation, including North Carolina and Delaware, which each had their third-driest spring on record.
Alaska’s average May precipitation was 3.03 inches, 0.92 inch above the 1925–2000 average, ranking as the fifth-wettest May in the 102-year record. For spring, precipitation was near average across the state, ranking in the middle third of the record.
Hawaiʻi experienced an exceptionally wet May, receiving 6.09 inches of precipitation—2.01 inches above the 1991–2020 average—and ranking in the wettest third of the 36-year record. This contributed to a historic spring (March–May) total of 34.42 inches—18.48 inches above average (215.9% of average)—and the wettest spring on record for the island chain.
Drought
According to the June 2 U.S. Drought Monitor report, about 58.4% of the CONUS was in drought, a decrease of about 3.3% from the end of April. Drought persisted over much of the western interior, Rockies and Plains, and expanded or intensified in parts of the Northwest, Southwest, northern Plains, Upper Midwest and Great Lakes, while improving over portions of the southern and central Plains. Parts of the South, Southeast and Northeast saw substantial drought contraction or improvement, though drought remained widespread across the southeast Atlantic coastal region.
Monthly Outlook
Above-average June temperatures are favored across the western and northern U.S., with the highest probabilities over parts of the Northwest and the northern Rockies and Plains. Above-average temperatures are also favored across the Florida Peninsula and portions of eastern Alaska, while below-average temperatures are favored for the Alaska Peninsula. Below-average precipitation is favored across the Northwest and Great Lakes region, while above-average precipitation is favored for parts of the Southwest and Southeast. Visit the Climate Prediction Center’s Official 30-Day Forecasts for more details.
Drought is expected to persist and expand across much of the Northwest and portions of the Southwest and northern Rockies and Plains, with development likely in parts of the Midwest. Although drought is expected to persist from portions of the southern Plains to the lower Ohio Valley and Mid-Atlantic, some improvement is anticipated across parts of the central and southern Plains, as well as much of the Southeast. Visit the U.S. Monthly Drought Outlook website for more details.
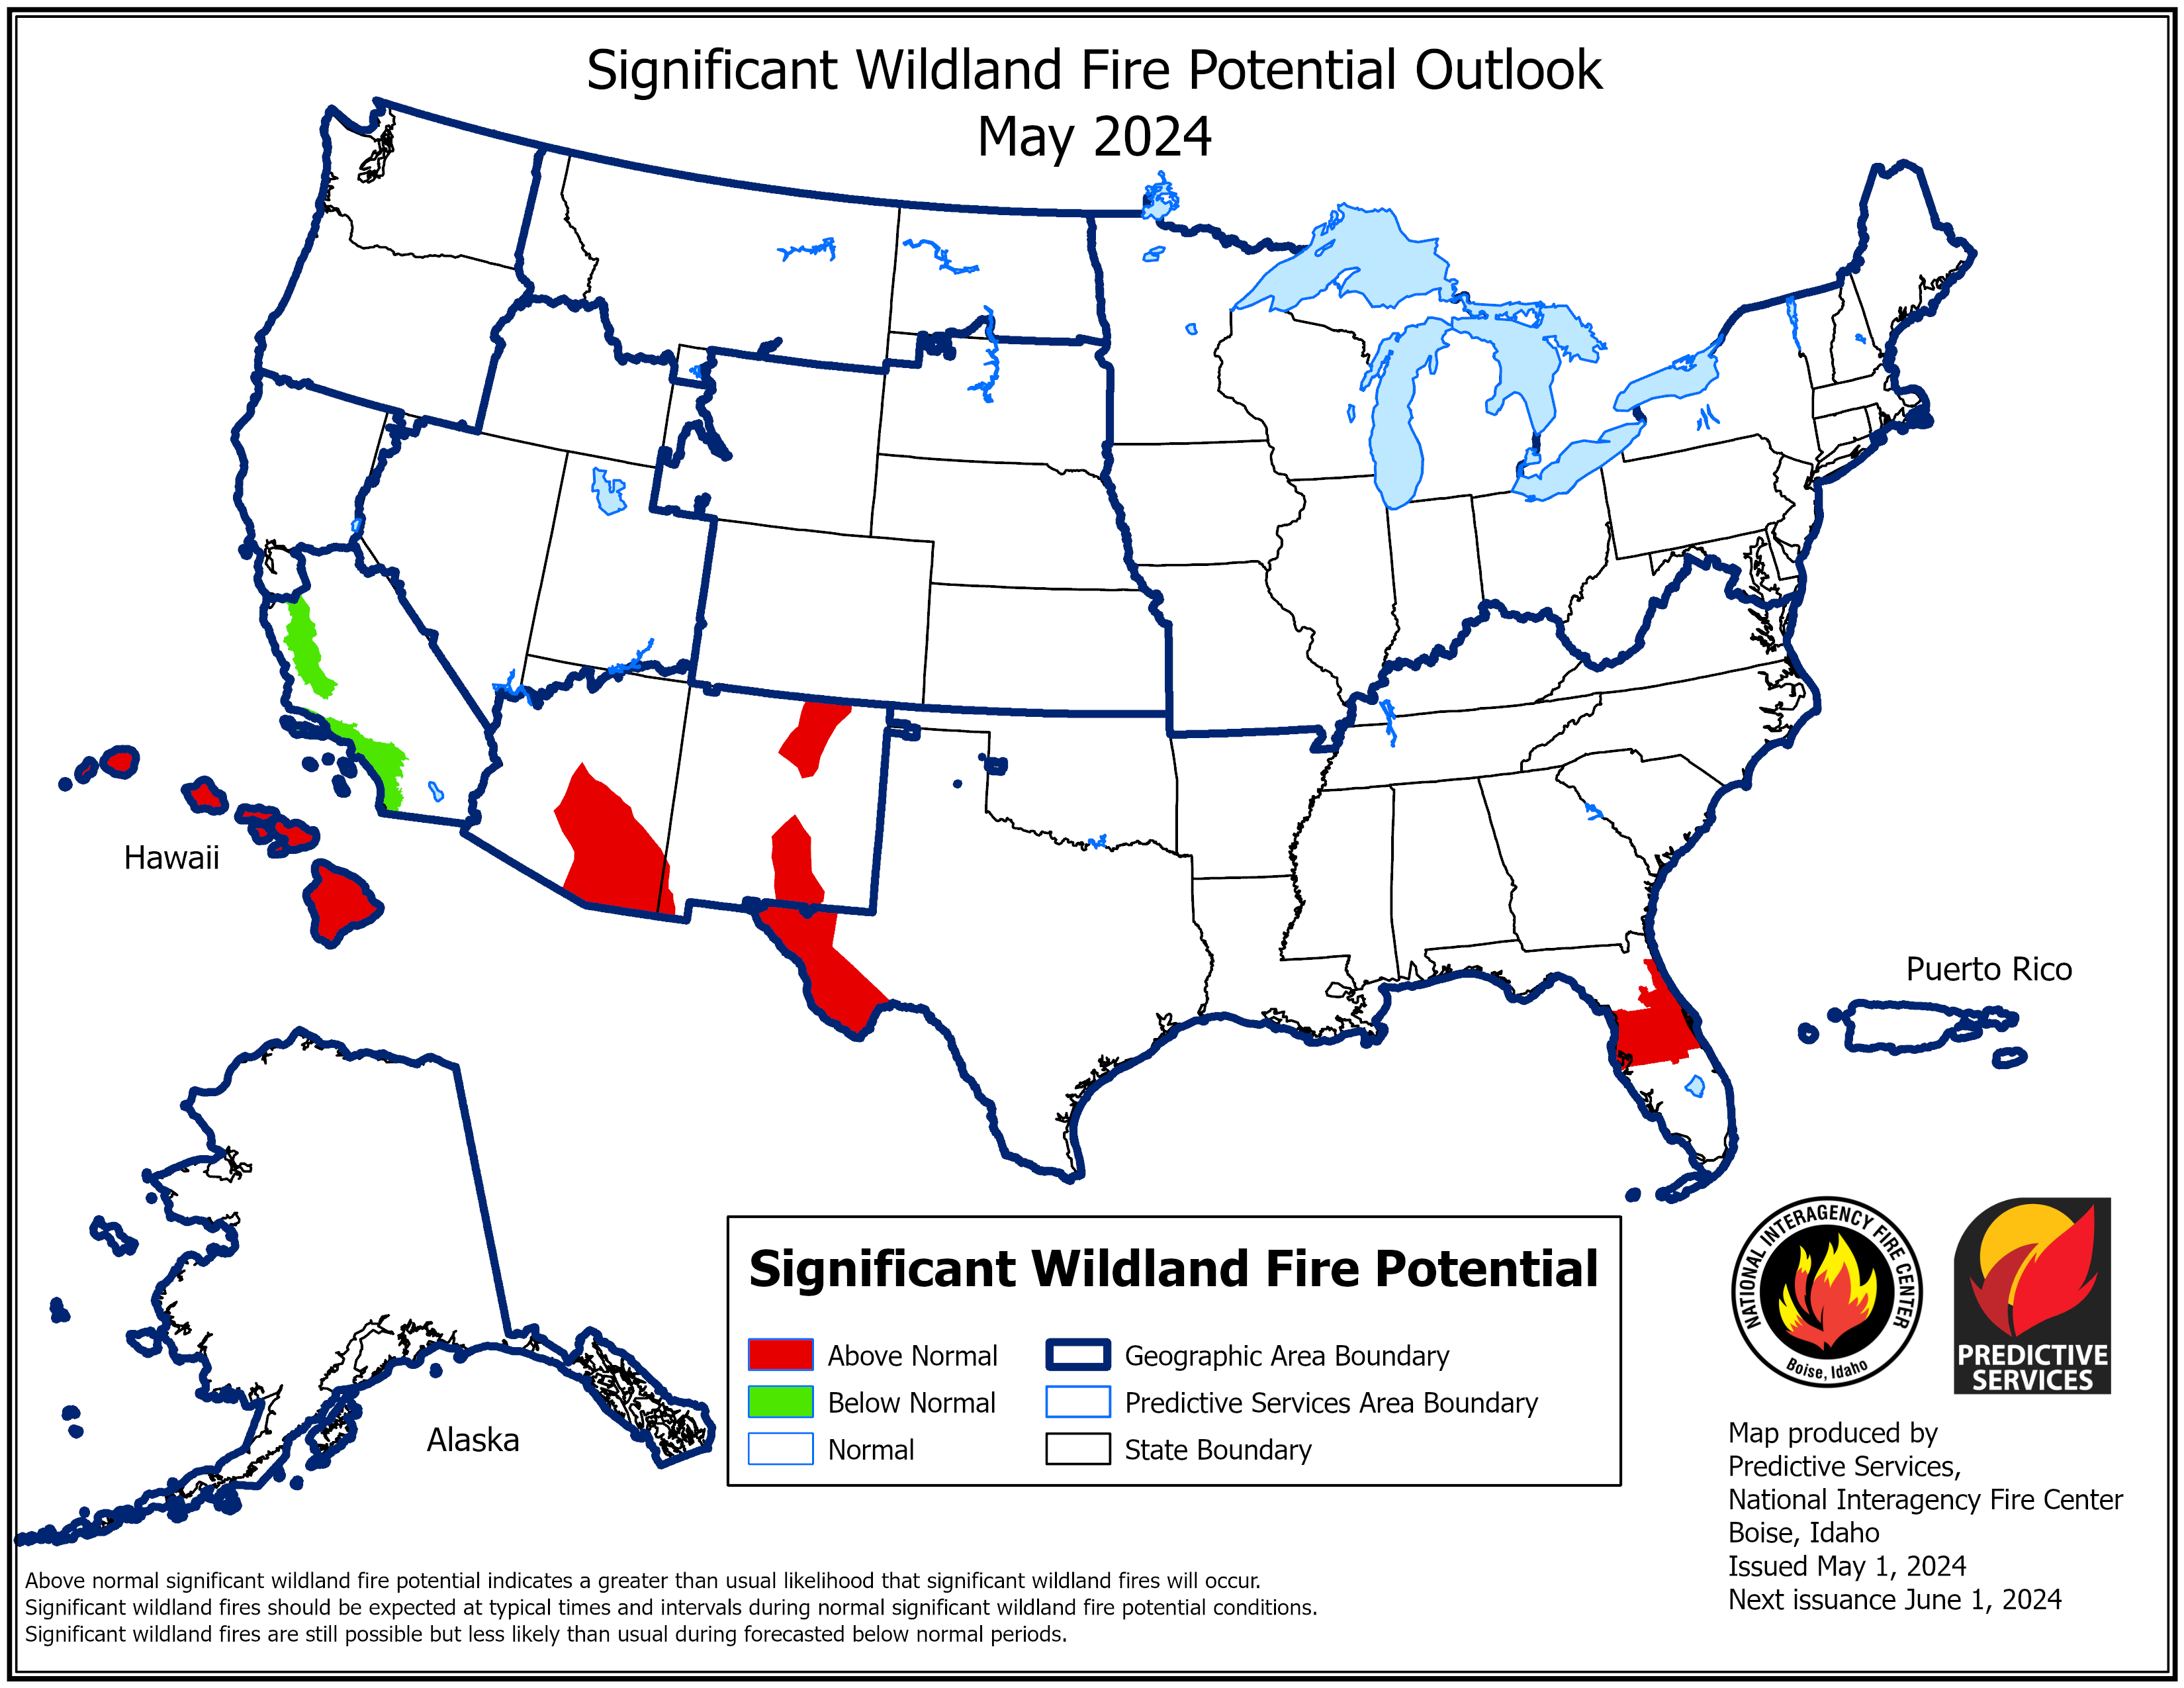
Significant wildland fire potential for June is above normal across portions of the West, as well as parts of the northern Plains and Upper Midwest. For additional information on wildland fire potential, visit the National Interagency Fire Center’s One-Month Wildland Fire Outlook.
For more detailed climate information, check out our comprehensive May 2026 U.S. Climate Report scheduled for release on June 11, 2026. For additional information on the statistics provided here, visit the Climate at a Glance and National Maps webpages.