
The NCEI Coastal Water Temperature Guide (CWTG) provides recent ocean and Great Lakes temperatures and average water temperatures collected from buoys, tide gauges, and other monitoring stations in the United States and its territories. In addition to water temperature, users have access to station pages that collect data on water levels, wave heights, wind speed, air temperature and pressure. The CWTG also includes a daily average of sea surface temperature to allow users to see water temperatures between physical stations.
Interactive Map
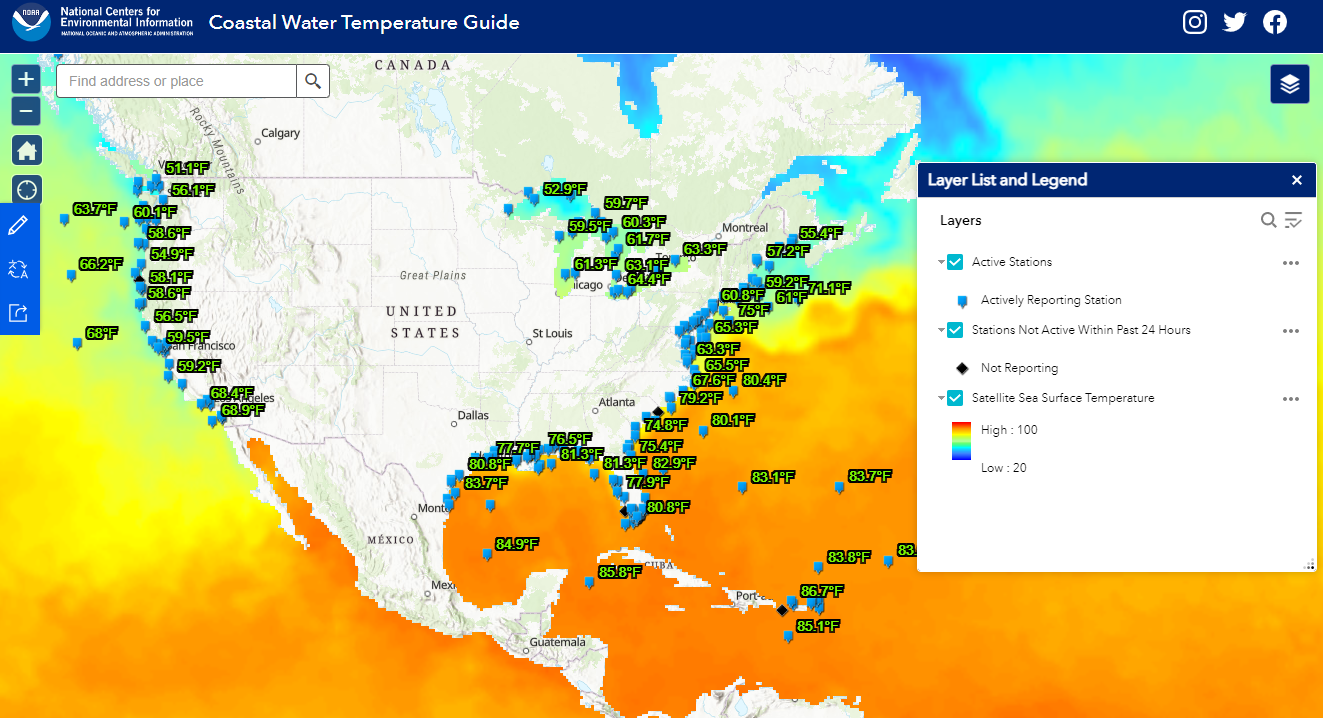
The Coastal Water Temperature Guide includes:
- Near real-time water temperatures on a GIS map
- Daily Averaged Sea Surface Temperatures (SST)
- Table of monthly averages
To compare an area’s recent ocean temperature to its average temperature, select a station on the map or view the table of monthly averages.
Data Sources
- Near real-time temperatures are from NOAA's National Ocean Service (NOS) tidal stations and Physical Oceanographic Real-Time System (PORTS®).
- Recent and near real-time water temperatures are also from NOAA's National Data Buoy Center (NDBC) moored buoys.
- Daily Averaged Sea Surface Temperature (SST) is from NOAA NCEI’s 1/4° Daily Optimum Interpolation Sea Surface Temperature (OISST) data set. It is a blended SST file of buoy, ship, Argo, and satellite observations.
* Use the near real-time water temperature data with discretion ~ may contain errors.
* When viewing the OISST layer, note that this is a daily average sea surface temperature and not real-time water temperature.
* All of the historical data available for each station was used to calculate the water temperature averages listed in the "Table of Monthly Averages". Because observations may vary with the station's status, a weighted-average method was used, based on the number of temperature observations available in a given month. Please note that some stations have been operating for decades, while others are newer.
Frequently Asked Questions
What is the best water temperature for swimming in the ocean?
There's no real optimal temperature, but many people feel “comfortable” swimming in water that is 70° to 78° Fahrenheit.
Can water temperatures differ between nearshore and offshore sites at the same latitude?
Yes, nearshore water temperatures are more susceptible to the influence of river runoff, higher cooling and heating rates, continental air masses, near-shore ocean currents, and upwelling effects.
Why is the water at the beach sometimes cold on warm summer days?
It could be due to a phenomenon known as upwelling, which occurs when displaced surface waters are replaced (upwelled) by colder, deeper waters. This can be caused by a persistent offshore wind blowing the warmer surface waters away from the shore.
Is it dangerous to swim in cold water?
Hot and cold water are relative, however, even in the summer, prolonged immersion in water temperatures below 70° Fahrenheit can produce hypothermia. Hypothermia, a subnormal body temperature, can occur in waters with cold or even moderate temperatures. The body quickly surrenders its heat to cold water, and chilled blood can impair the heart and brain. Swimming or treading water will greatly increase heat loss and may limit your range to less than one-half mile. Use H.E.L.P. (Heat Escape Lessening Posture) if alone, or huddle with others. This can possibly extend your survival time.
There are no buoys or tide stations near my beach. How can I see what the water temperature is closer to me?
You can use the satellite daily averaged sea surface temperature to get an approximate temperature for beaches and other coastal areas that aren’t near a buoy or tide station. This layer doesn’t provide real time temperature, but it's a close approximation that can be used for recreational purposes.


