Atlantic TAlk Crossovers
System Information
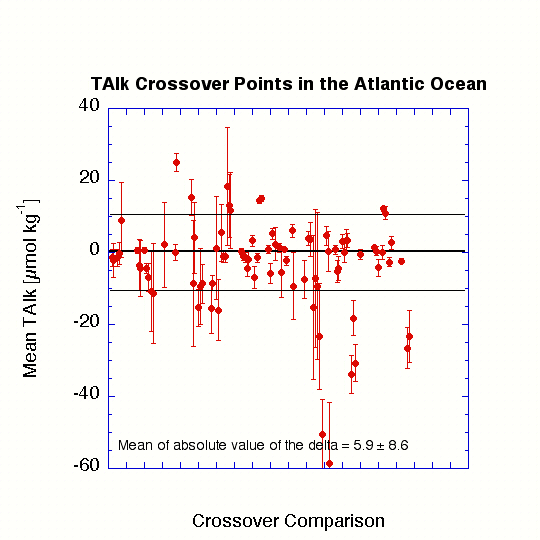
The purpose of this analysis was to determine if any significant systematic offset existed between the various legs of the WOCE/NOAA/JGOFS Atlantic Ocean total alkalinity (TALK) measurements. The stations selected for each crossover were those with carbon data that were within roughly 100 km (≈1° latitude) of the crossover point. Data from deep water (>1500 m) at each of the crossover locations were plotted against the density anomaly referenced to 4000 dbar (σ-4) and fit with a second-order polynomial. The difference and standard deviation between the two curves was then calculated from 10 evenly spaced intervals over the density range common to both sets of crossovers. The figure below shows the results in graphical form, where the sequence of values is that of the summary table of crossover results. The error bars depict the standard deviation of the 10 points over the density range. The horizontal lines are the average (middle line) and standard deviation of the points on the graph (upper and lower lines), omitting the ones that are excluded from analysis (shown as italicized values in the summary table).
Summary Table of Crossover Results (opens a new window)

Summary
Using the crossover differences estimated from the polynomial fits, the 63 crossover analyses at 53 locations for TALK had an average and standard deviation of 0.2±10.5 µmol/kg. The average and the absolute values of the differences was 5.9±8.6 µmol/kg. TALK values from A06, A07, and A01E were deemed of insufficient quality to be included in the basinwide database. More details on the TALK crossover analysis can be found in Wanninkhof et al. (2003).
