

Halloween marks a tricky time of year for meteorologists and climatologists as autumn is in full swing across the Northern Hemisphere. In the United States, the spooky celebration, well known for its weather variations from year to year, sees normal high temperatures ranging from the 40s to the 80s and normal lows ranging from the teens to the 70s across the contiguous states alone.
October U.S. Climate Conditions
In fact, many U.S. locations experience drastic temperature swings throughout the month of October. In some years, summer’s warmth can hang on through the month while in others snow and freezing temperatures may make an early appearance. But, overall, the lower 48 states usually see an average temperature of around 54°F for the month.
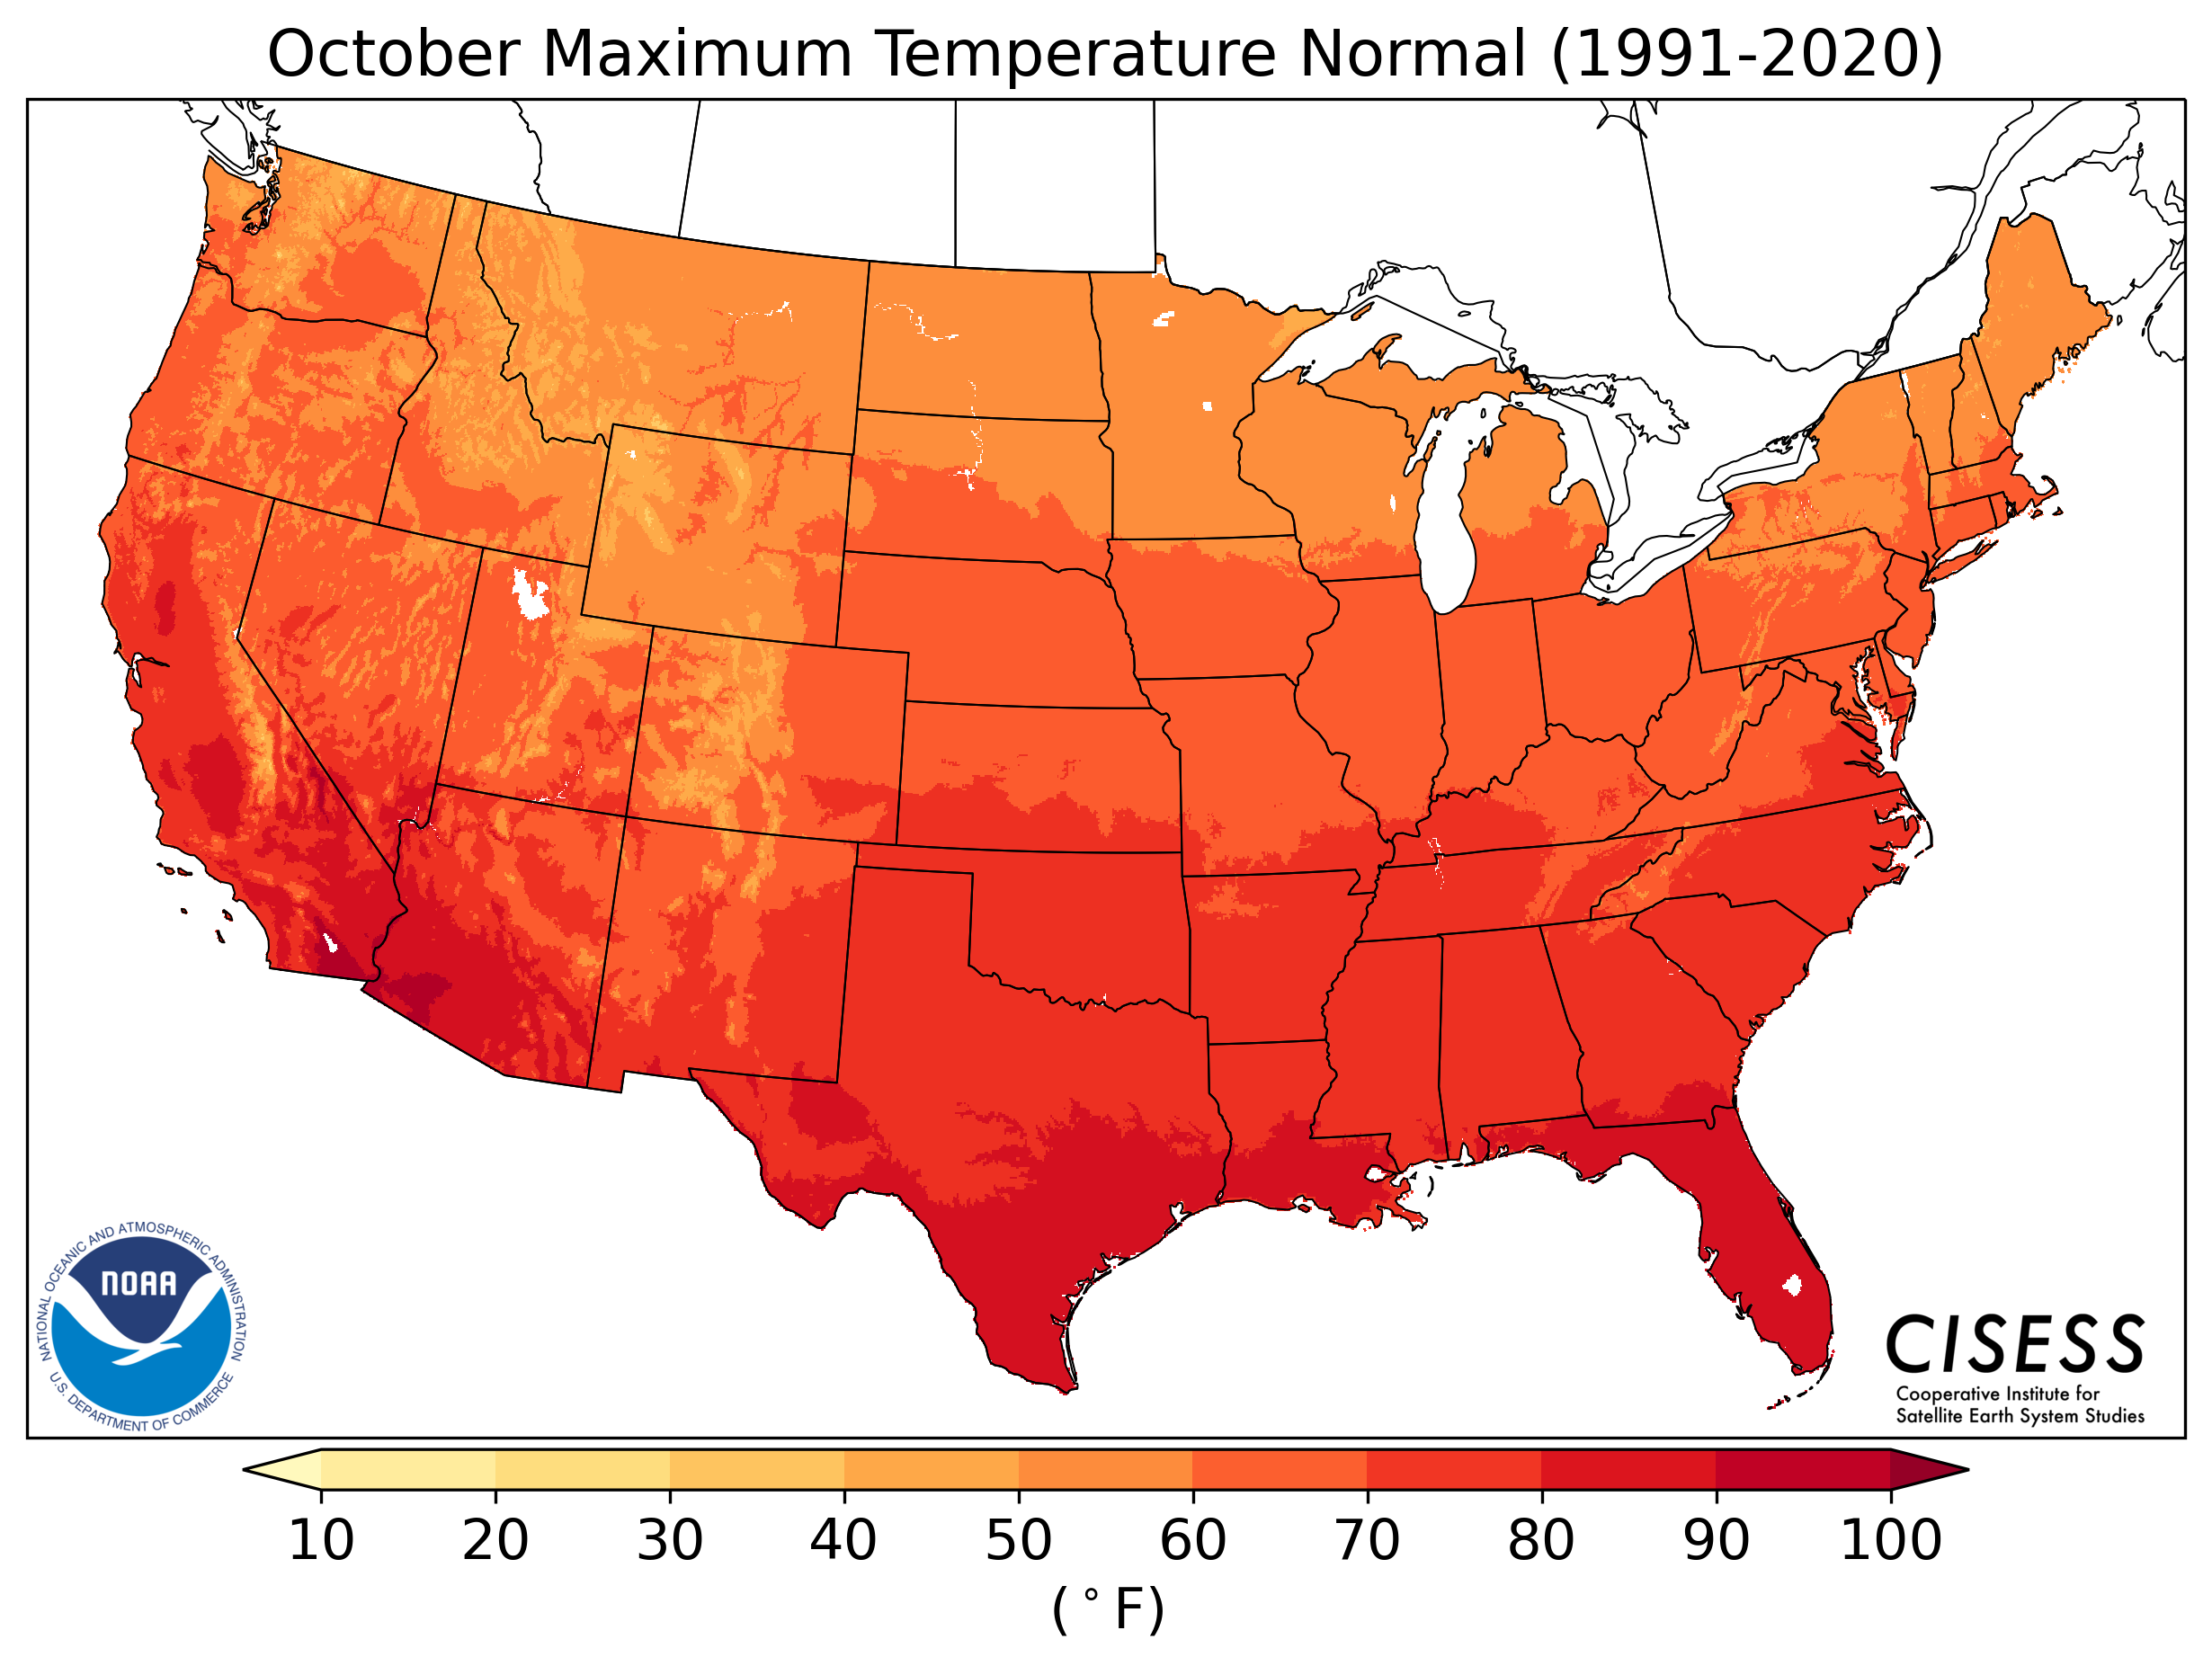
Temperatures
The contiguous United States saw its warmest October on record in 1963, with an average temperature of 59.4°F. Fourteen states across the Rockies, Great Plains, and Midwest had their warmest October on record that year. Conversely, the country saw its coldest October on record in 1925, with an average temperature of 48.9°F. Twenty-two states from the Great Plains to New England experienced a record cold October. Overall, Octobers across the contiguous United States have warmed at a rate of about 0.8°F per century since 1895.
Precipitation
October is also the first month of the cold season that typically brings snow to parts of the nation. The Rockies and parts of the Northern and Central Plains into the Upper Midwest typically observe their first snowfall during the month. Higher elevations in the East have also observed snow in October. Generally, the contiguous United States sees an average of about 2 inches of liquid precipitation during October.
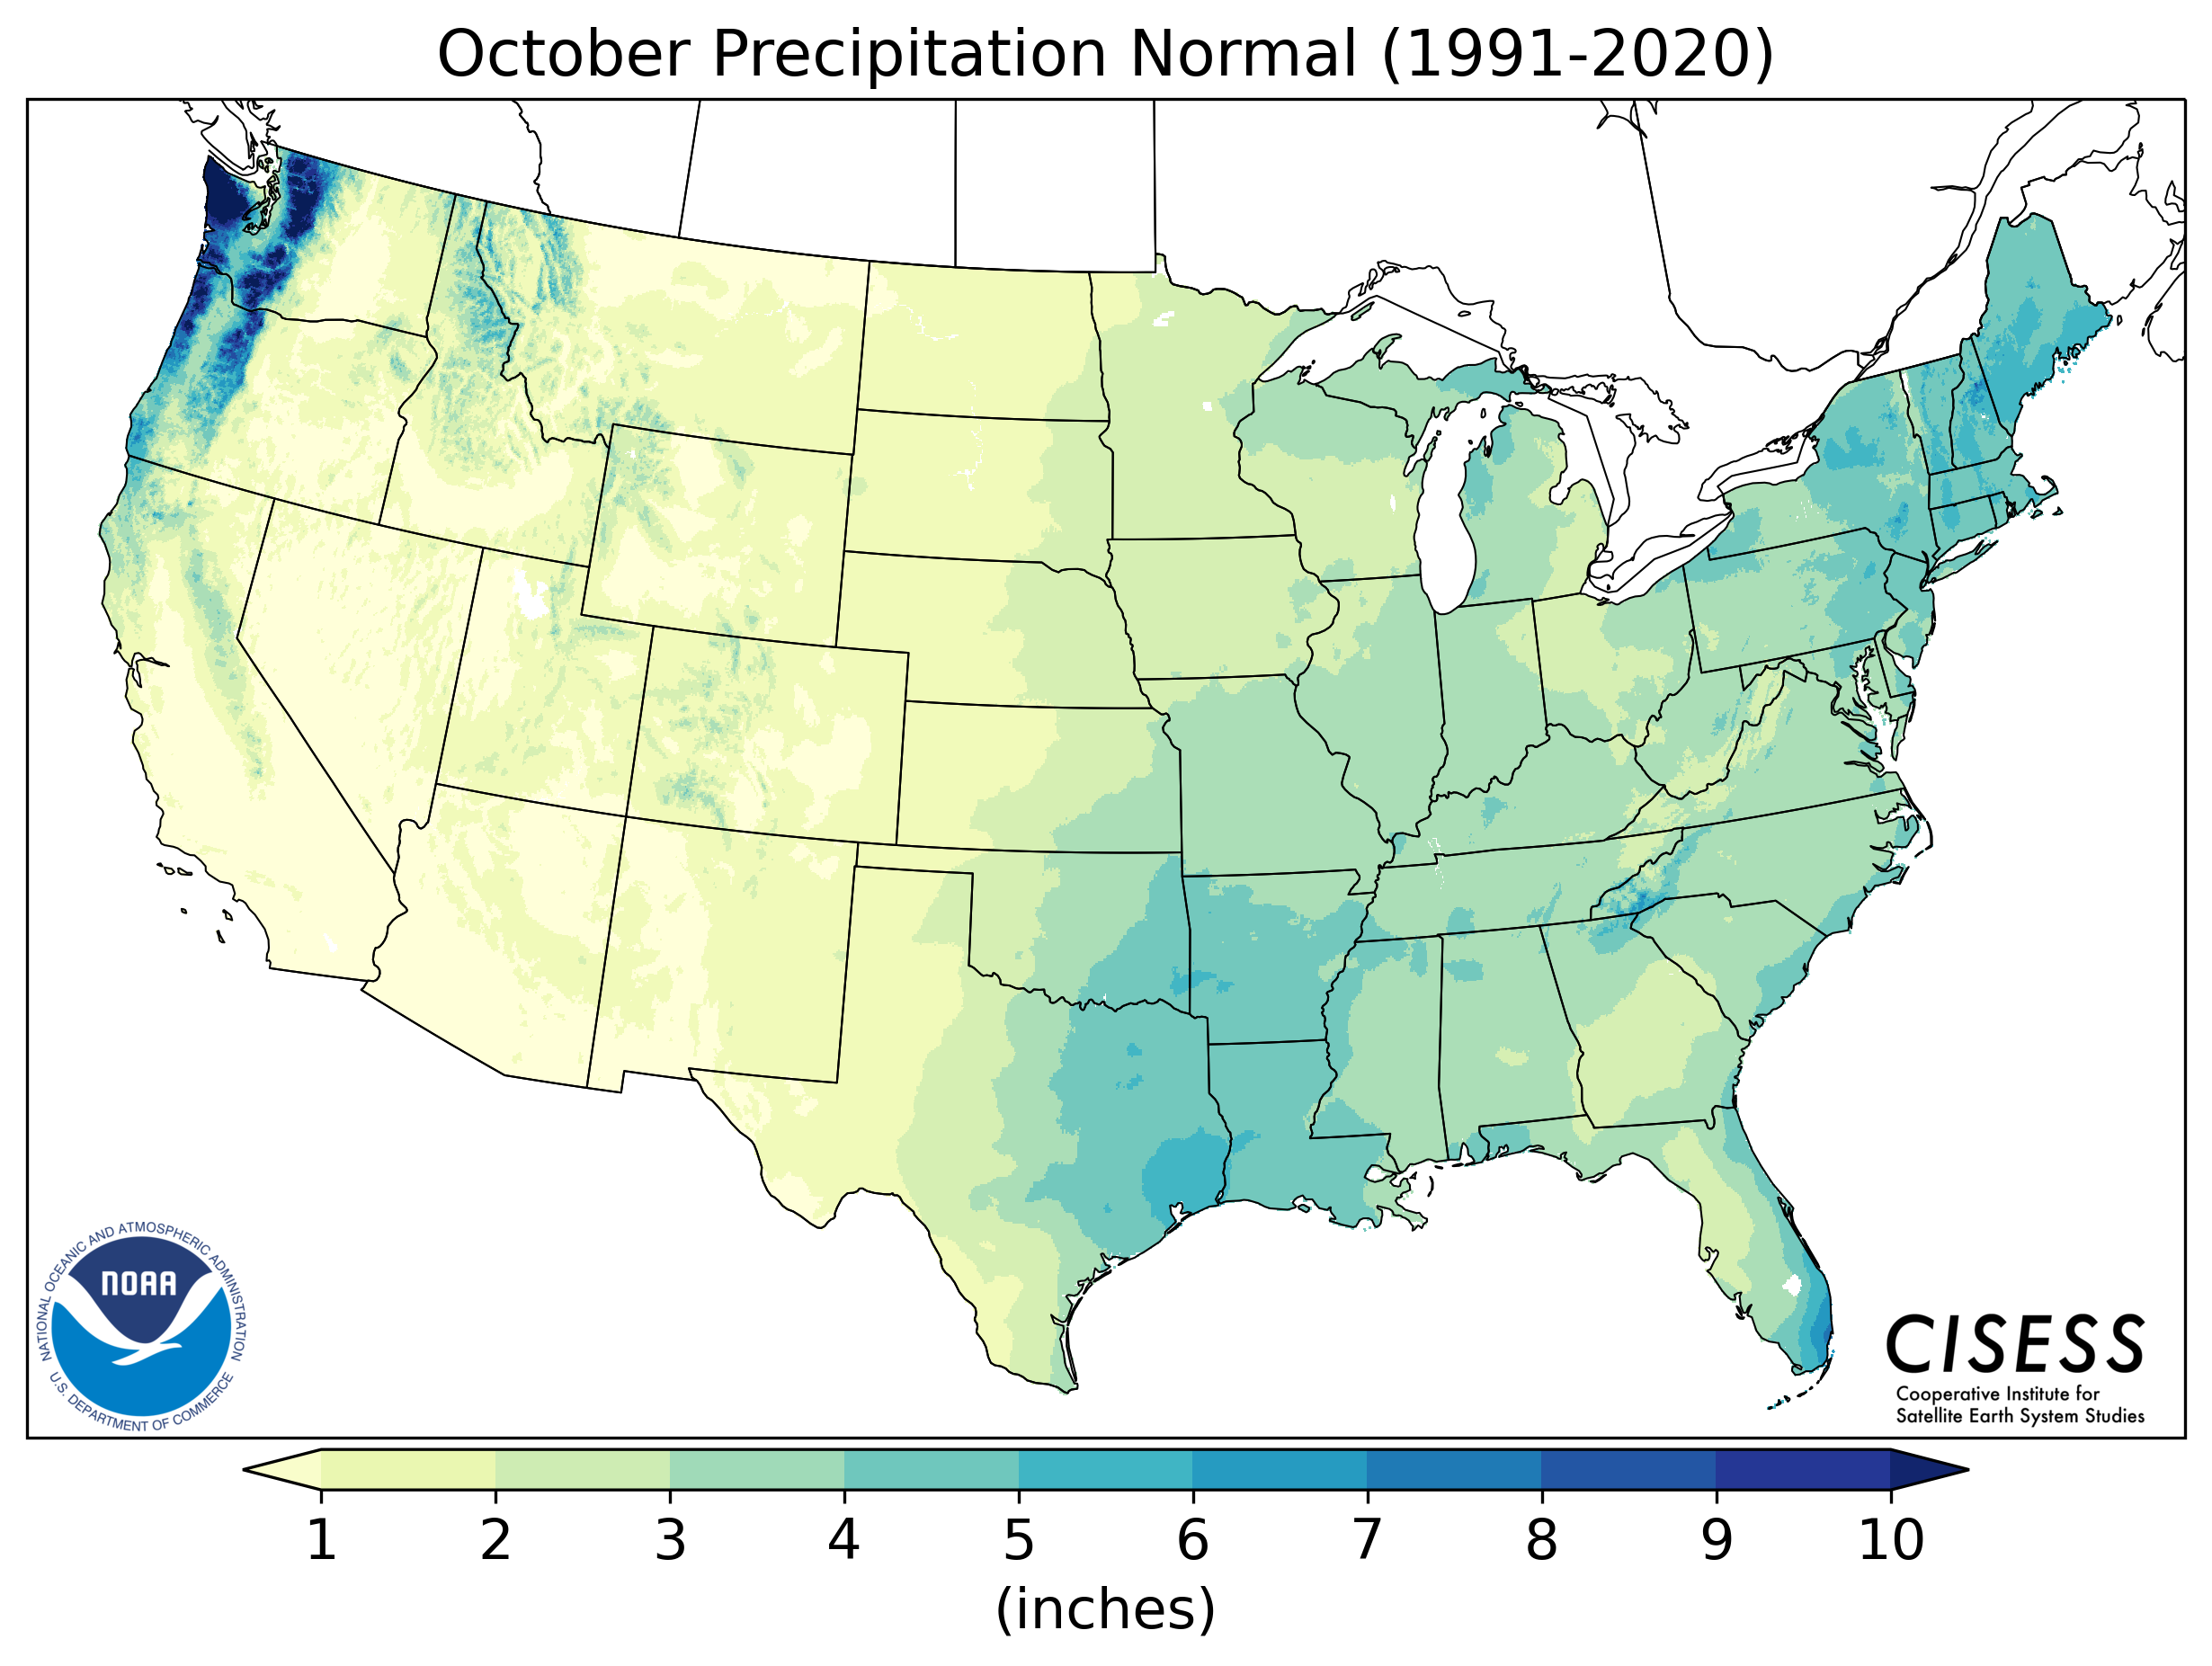
The country saw its driest October on record in 1952, with an average of just 0.54 inches of precipitation for the lower 48 states. The wettest October on record occurred in 2009, when the country observed an average of 4.29 inches of precipitation. That year, three states through the Mississippi River Valley observed their wettest October on record. Overall, the contiguous U.S. precipitation total during October has increased at a rate of about 0.5 inch per century since 1895.
Hurricanes and Tornadoes
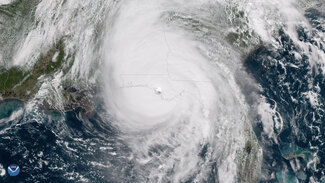
October is near the end of the peak of hurricane season in the North Atlantic. During the month, the North Atlantic typically sees 1.9 tropical storms and 1.1 hurricanes each year and a major hurricane about every other year. The highest number of tropical storms the North Atlantic has seen in October is six (in 1870, 1887, 1950, 2005, and 2019). The basin saw the most October hurricanes in 1870 with six occurring that year. And, the highest number of major hurricanes the basin has seen in October is three in 2020.

Even though the North Atlantic Basin hurricane season is typically winding down in October, several deadly and very costly storms have struck the United States during the month. For example, Hurricane Michael made landfall near Mexico Beach, Florida, on October 10, 2018, with sustained winds of 155 mph and a central pressure of 920 mb. At landfall, Michael was a Category 5 storm and also the strongest land falling mainland U.S. hurricane in terms of pressure since Camille in 1969. Michael was the first Category 5 hurricane to strike the contiguous U.S. since Andrew in 1992 and was also the strongest hurricane to impact the mainland United States during the month of October.
Ranking as the fifth-costliest hurricane to hit the United States since 1980, Superstorm Sandy made landfall near Atlantic City, New Jersey, on October 29, 2012. Sandy’s impact on major population centers caused widespread interruptions to critical water and electrical services. The storm caused $86.5 billion in damages (inflation-adjusted) and 159 fatalities.
In 2005, Hurricane Wilma made landfall in southwest Florida as a Category 3 storm, causing $29.3 billion (inflation-adjusted) in damages and 35 fatalities. Prior to landfall, Wilma went down in history with the lowest central pressure ever recorded in the Atlantic basin (882 mb) while it was a Category 5 storm. Hurricane Opal in 1995 was also one of the worst October hurricanes to hit the United States, causing $9.4 billion (inflation-adjusted) in damages and 27 fatalities.
Tornado activity typically drops off rapidly during October. On average, the United States sees about 61 tornadoes during the month—compared to an average of 276 in May, which is historically the country’s most active month. Despite the low tornado average, large and damaging tornado outbreaks have occurred during October, mostly across the Southern Plains and Southeast. The deadliest October tornado was an F4 spawned by Hurricane Hilda on October 3, 1964, which killed 22 people in Larose, Louisiana.
October 31 Climate Normals for Spooktacular U.S. Locations
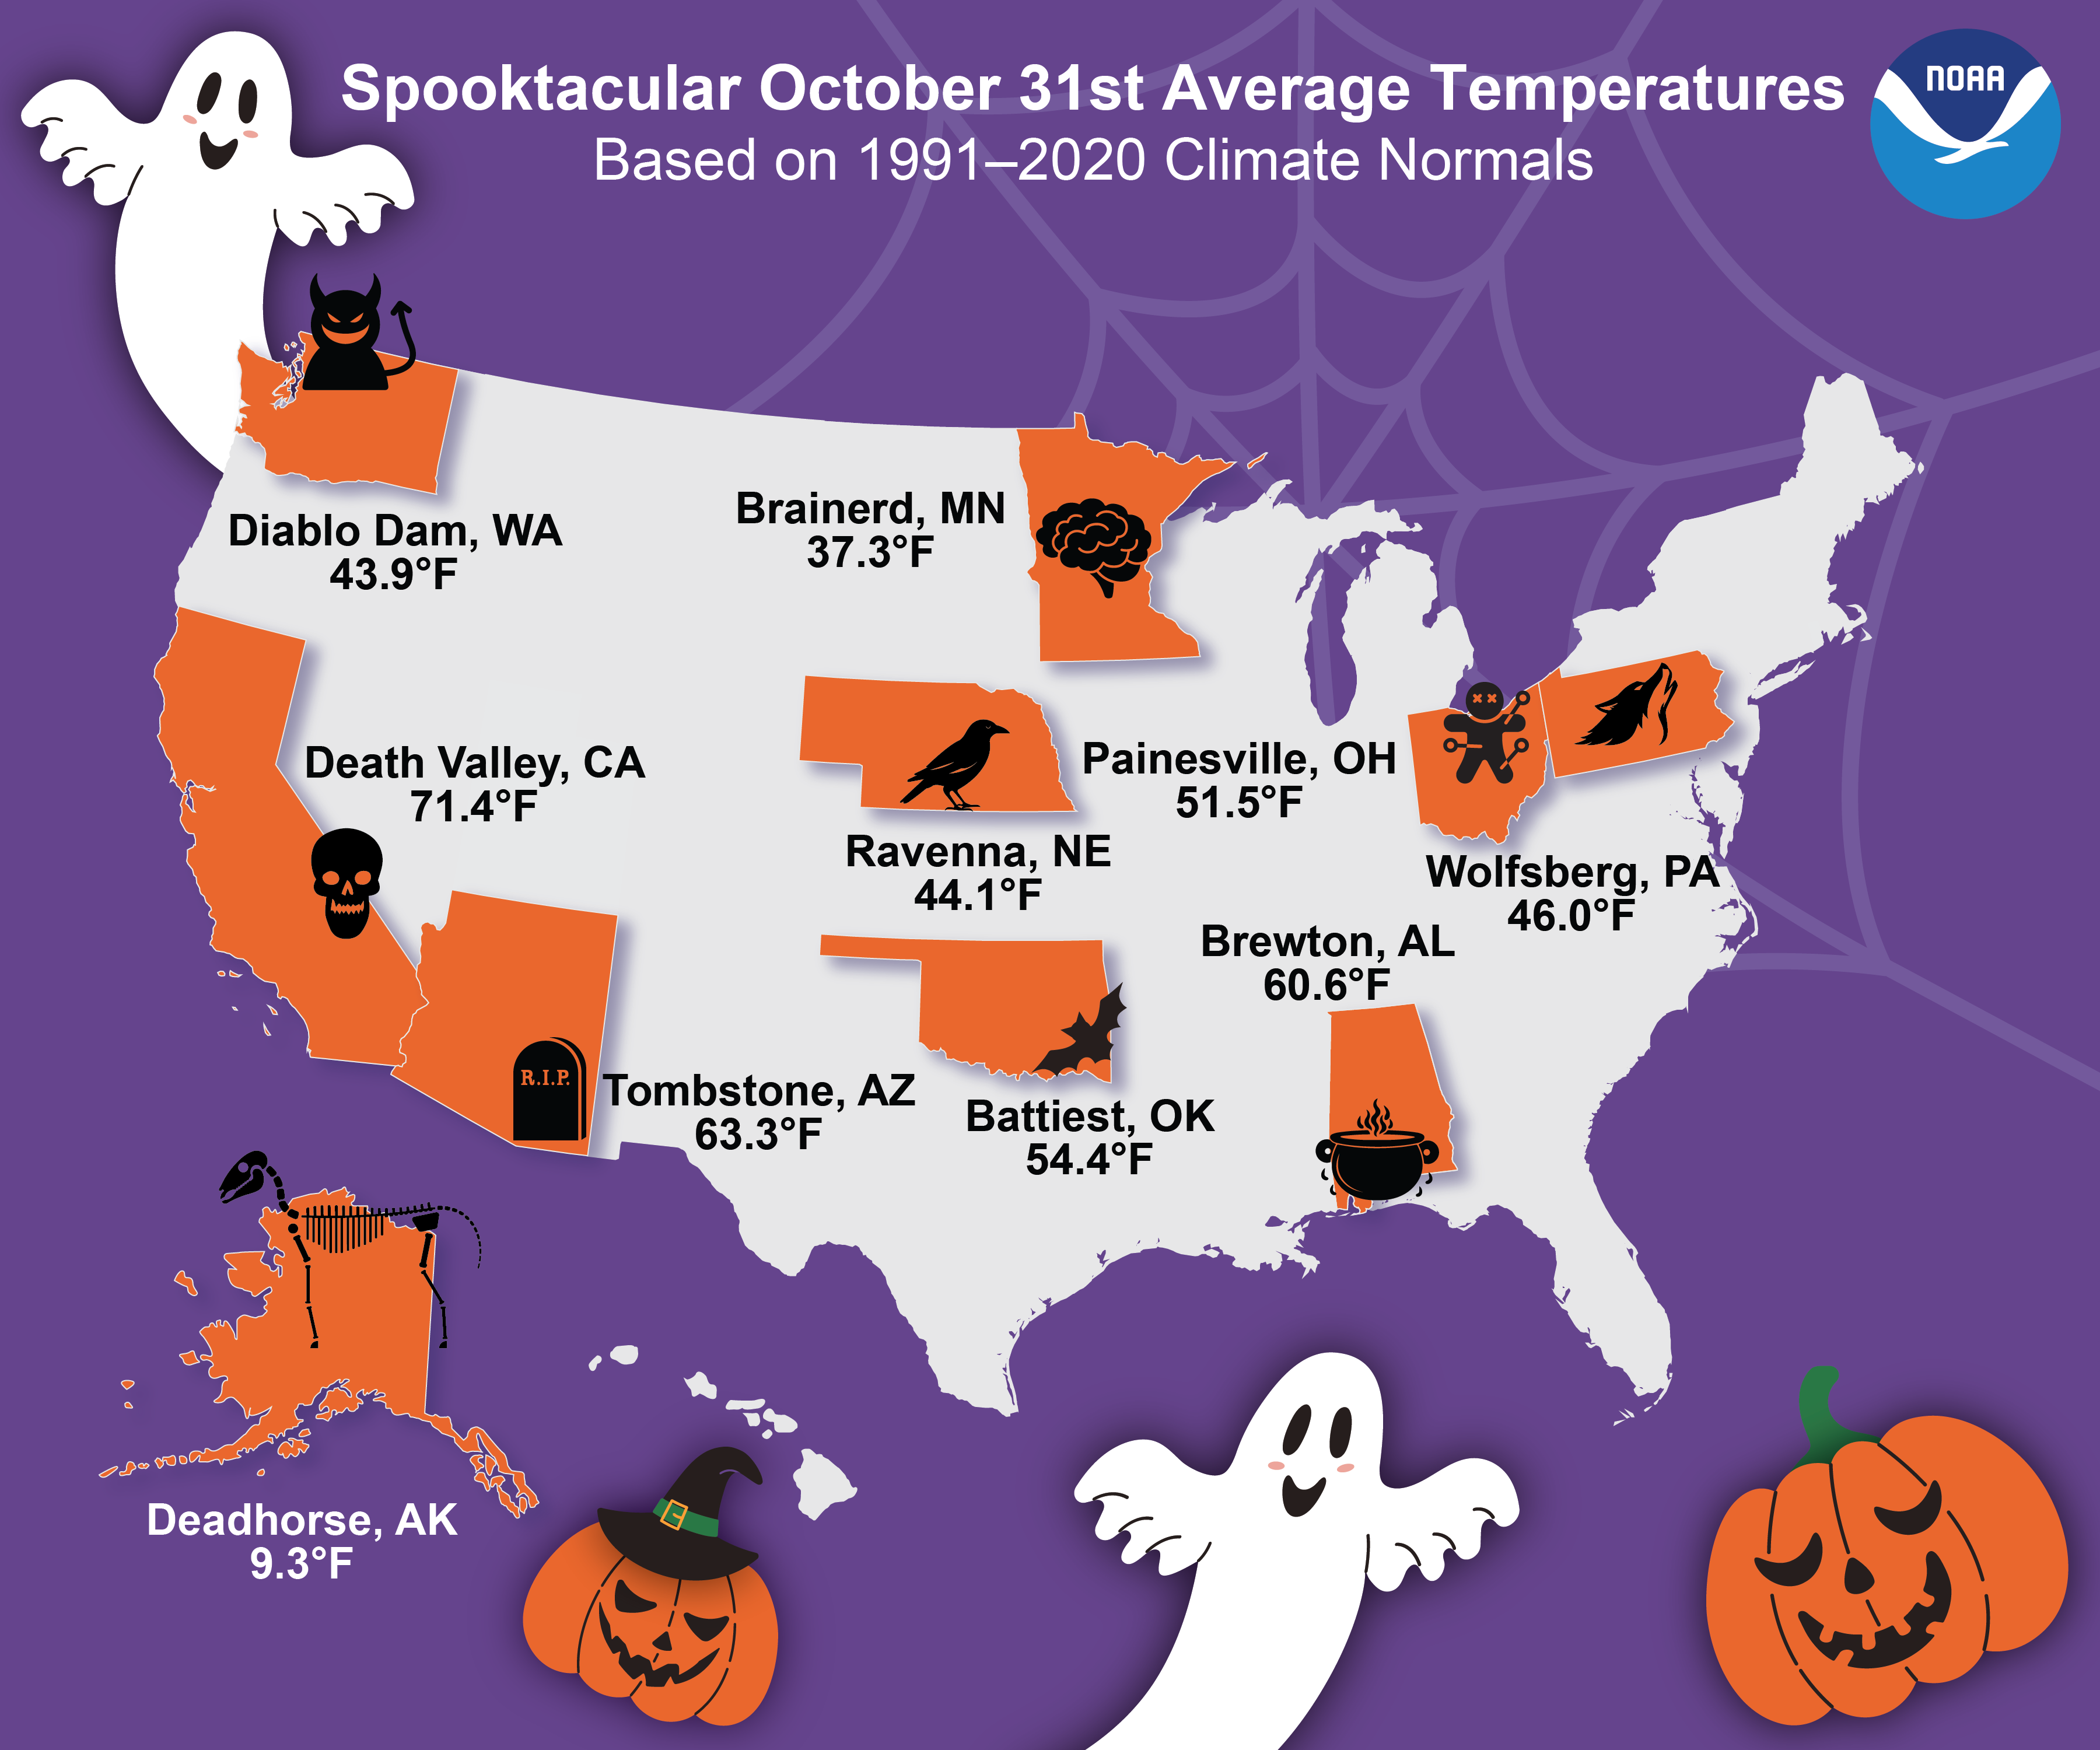
In such a geographically and climatologically diverse country, average conditions can vary from day to day and from place to place across the United States. From Death Valley’s heat to frigid temperatures in Deadhorse, the table below shows the normal minimum, average, and maximum temperatures on October 31 for 10 locations with Halloween-themed names, according to our daily 1991–2020 Climate Normals data.
Location | Minimum Temperature | Average Temperature | Maximum Temperature |
Battiest, Oklahoma | 41.1°F | 54.4°F | 67.8°F |
Brainerd, Minnesota | 27.7°F | 37.3°F | 46.9°F |
Brewton, Alabama | 48.4°F | 60.6°F | 72.9°F |
Deadhorse, Alaska | 2.7°F | 9.3°F | 16.0°F |
Death Valley, California | 57.2°F | 71.4°F | 85.7°F |
Diablo Dam, Washington | 37.8°F | 43.9°F | 50.1°F |
Painesville, Ohio | 43.9°F | 51.5°F | 59.0°F |
Ravenna, Nebraska | 29.4°F | 44.1°F | 58.8°F |
Tombstone, Arizona | 49.8°F | 63.3°F | 76.7°F |
Wolfsberg, Pennsylvania | 33.7°F | 46.0°F | 58.4°F |
While our Climate Normals provide average temperatures throughout the United States, this Halloween’s actual conditions may vary widely based on weather and climate patterns. For prediction of your actual local daily temperature, check out your local forecast office on Weather.gov.
For an in-depth analysis of recent climate conditions, check out our U.S. Climate Report.


