NOAA’s data tells the story of one of the worst tornado outbreaks in U.S. history 50 years later

The “Super Outbreak” that struck much of the central and eastern U.S. and parts of Canada on April 3-4, 1974 holds numerous tornado-related records to this day, including the largest number of F5* tornadoes in a single outbreak (Corfidi et al., 2004) and the second-highest number of tornadoes in a single day, behind only the Super Outbreak of 2011.
Many of the tornadoes that occurred as part of the outbreak are known for their significance on their own. Examples include deadly, long-track F5 tornadoes that devastated Xenia, Ohio, Brandenburg, Kentucky, and Guin, Alabama, among many others.
The human toll of the outbreak can never be fully accounted for, but some statistics related to the outbreak help present an idea of its significance:
- 148 confirmed tornadoes in the U.S. and Canada
- 30 F4 and F5 tornadoes
- The total path length of all tornadoes in the outbreak: 2,598 miles
- 335 direct fatalities
- Over 6,000 injured
- 13 states (plus an F3 in Ontario)
- 2024 CPI-adjusted losses of approximately $5.3 billion**
*The currently used Enhanced Fujita Scale (EF-scale) for rating tornadoes was not implemented until 2007, with all tornadoes rated before that using the Fujita (F) scale retaining their rating.
**NCEI Billion-Dollar Disasters product accounts only for disasters from 1980 and after, so the 1974 Super Outbreak does not appear.
Meteorology
On April 2, 1974, a circulation that would eventually become a strong low pressure system began to develop on the lee side of the Rocky Mountains in Colorado.
By the morning of April 3, strong winds at both the upper and lower levels of the atmosphere and a stark contrast between the dry air to its northwest and warm, moist Gulf air to its southeast helped the system to develop explosively. Those same atmospheric conditions set the stage for plentiful wind shear (winds changing speed and direction at different levels of the atmosphere) and instability (available energy in the atmosphere) ahead of the system as it raced across the U.S., combining all ingredients needed for a major outbreak of severe storms, especially strong tornadoes.
Observing the Outbreak
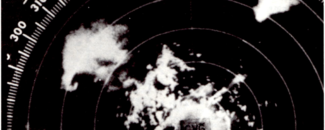
During the outbreak, National Weather Service (NWS) meteorologists used the Weather Surveillance Radar-1957 (WSR-57) to detect and warn of severe and tornadic thunderstorms. It may not look comparable to radar imagery we see today (most of which is from the newer WSR-88D, or Weather Surveillance Radar-1988 Doppler radars in the U.S.), but this imagery proved critical in saving many lives.
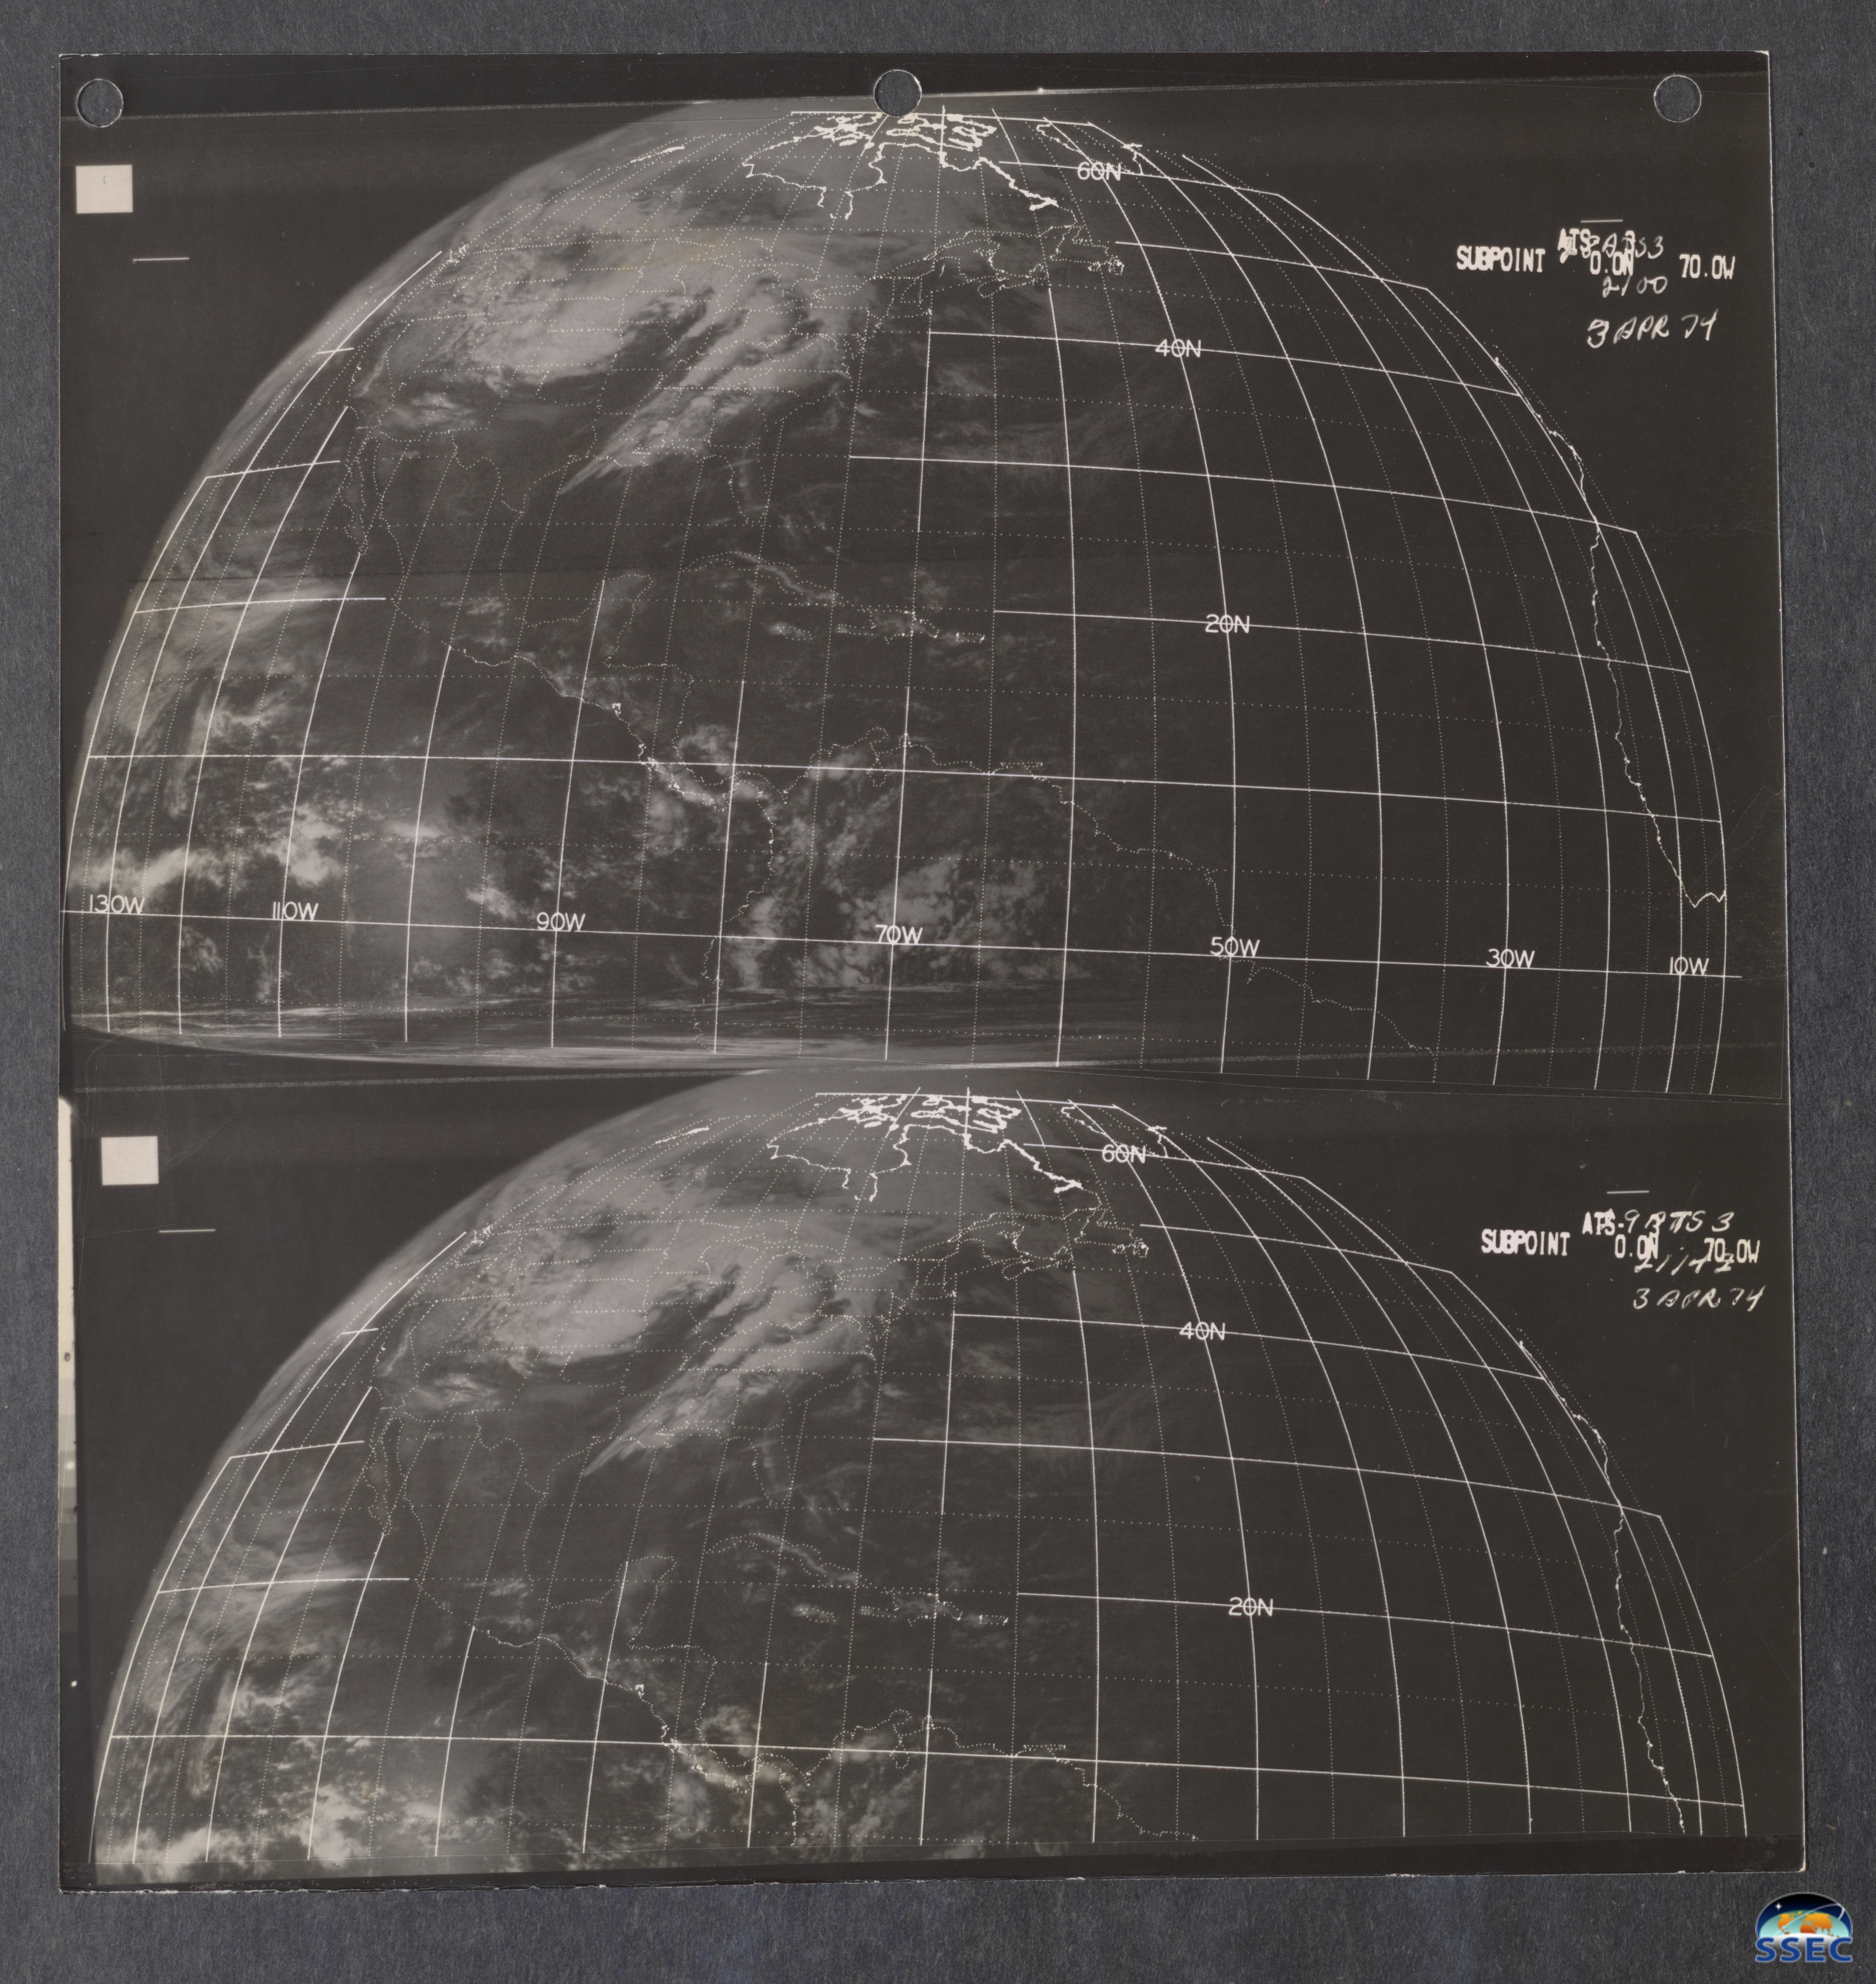
A NASA satellite with early environmental surveillance capabilities, the Applications Technology Satellite 3 (ATS-3), gave a much wider view of the intense low pressure system and associated frontal boundaries that brought devastating severe weather to much of the eastern half of the country during the Super Outbreak.

Storm Data Provides Insight
NCEI maintains and stewards the Storm Events Database, which was used to create the NOAA Storm Data Publication. It documented “the occurrence of storms and other significant weather phenomena having sufficient intensity to cause loss of life, injuries, significant property damage, and/or disruption to commerce.” It also cataloged rare or unusual weather phenomena that generated media attention, such as snow in South Florida, or other significant meteorological events like record minimum/maximum temperatures or precipitation.
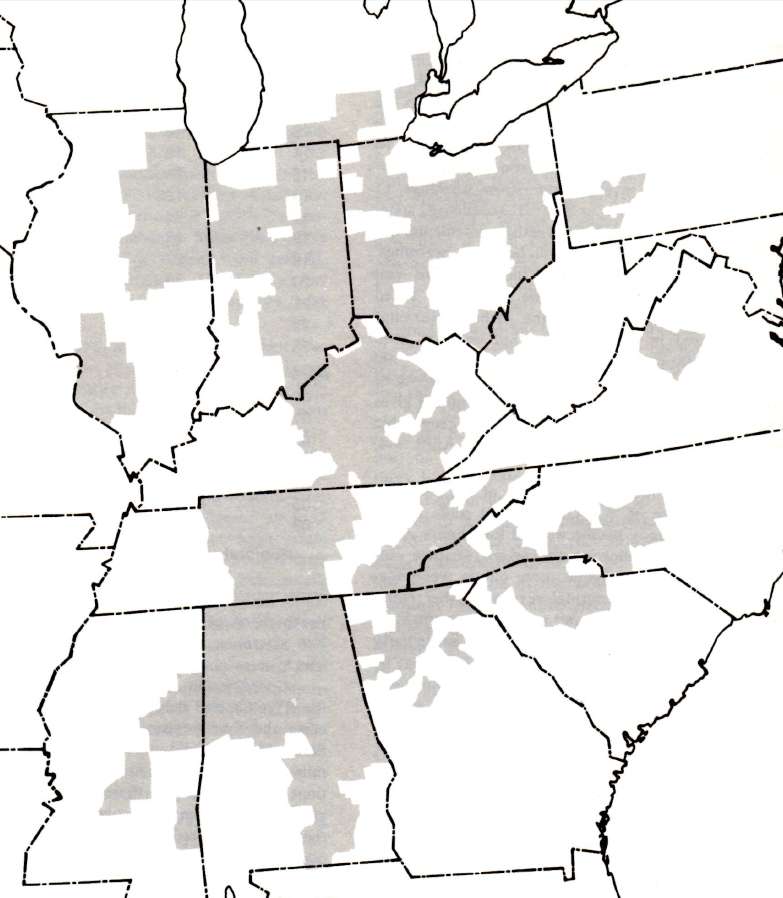
The Storm Data Publication for April 1974 details the numerous tornadoes, extensive damage, and deaths/injuries that occurred across 13 states in the U.S. during the Super Outbreak. While tornadoes are usually highlighted as the most dangerous and deadly phenomena of the outbreak, numerous severe storms that did not produce tornadoes still resulted in significant damage due to strong straight-line winds and large hail.
Warnings, Communications, and a Path Forward
A NOAA Disaster Assessment Report about the outbreak found that though the performance of the NWS was admirable under the extreme conditions presented by the outbreak, gaps in storm detection, warnings, and communication existed. These findings were used to inform warning and communication strategies that helped modernize the NWS and its warning capabilities.

It was noted that though there was a significant loss of life during the outbreak and that NWS warnings did help to prevent many deaths, many lives were spared due to good fortune with the timing and tracks of tornadoes (i.e., the Xenia, Ohio F5 struck the town just hours after school dismissal, likely preventing catastrophic losses). Better communication with all sectors involved in hazardous weather preparation and emergency response, notably mass media and emergency management, was borne of the outbreak, helping to preserve life and property up to the present and beyond.
The outbreak also highlighted the need for enhanced weather and storm observing capabilities across the U.S. and beyond, spurring the funding and development of new technologies in radar and satellite meteorology, many of which are still in use in the NWS to this day. For local weather forecasts, see the NWS and for severe weather forecasting and outlooks up to eight days in advance, see the Storm Prediction Center.
