
Climate data used to predict the appearance of a 17-year-old insect

Brood X Background
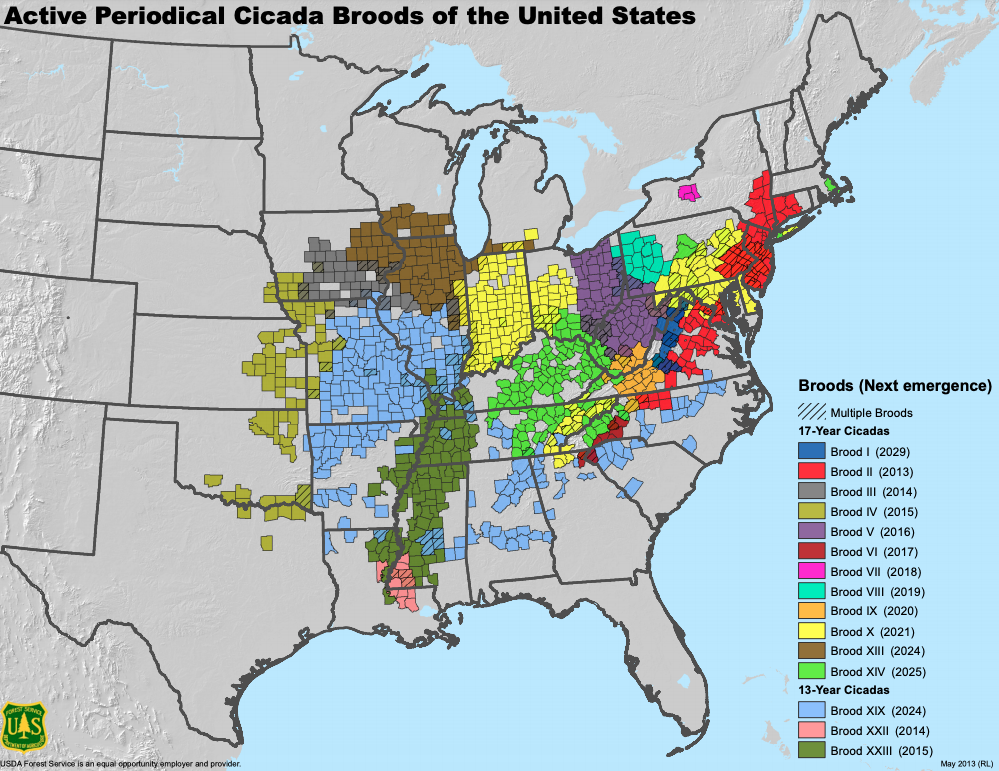
Spring 2021 marks the return of a loud and eagerly awaited horde of insects, Brood X of the 17-year periodical cicada. Brood X is a regional population of periodical cicadas that have lived underground for 17 years awaiting their emergence to the surface to mate. These bugs with their black bodies, striking red eyes, and orange-veined wings are not considered pests despite their menacing appearance. The awe-inducing arrival of a brood of periodical cicadas is commonly mistaken for locusts, which are similarly loud but are more grasshopper-like in appearance. The cacophony of noise created by Brood X was first reported in 1715 in Philadelphia, Pennsylvania, and its return has insect enthusiasts eager to hear the insects’ spring call. The Brood X emergence is expected to cover areas of the Midwest, Southeast, and the mid-Atlantic in the United States.
Cicada Emergence Details
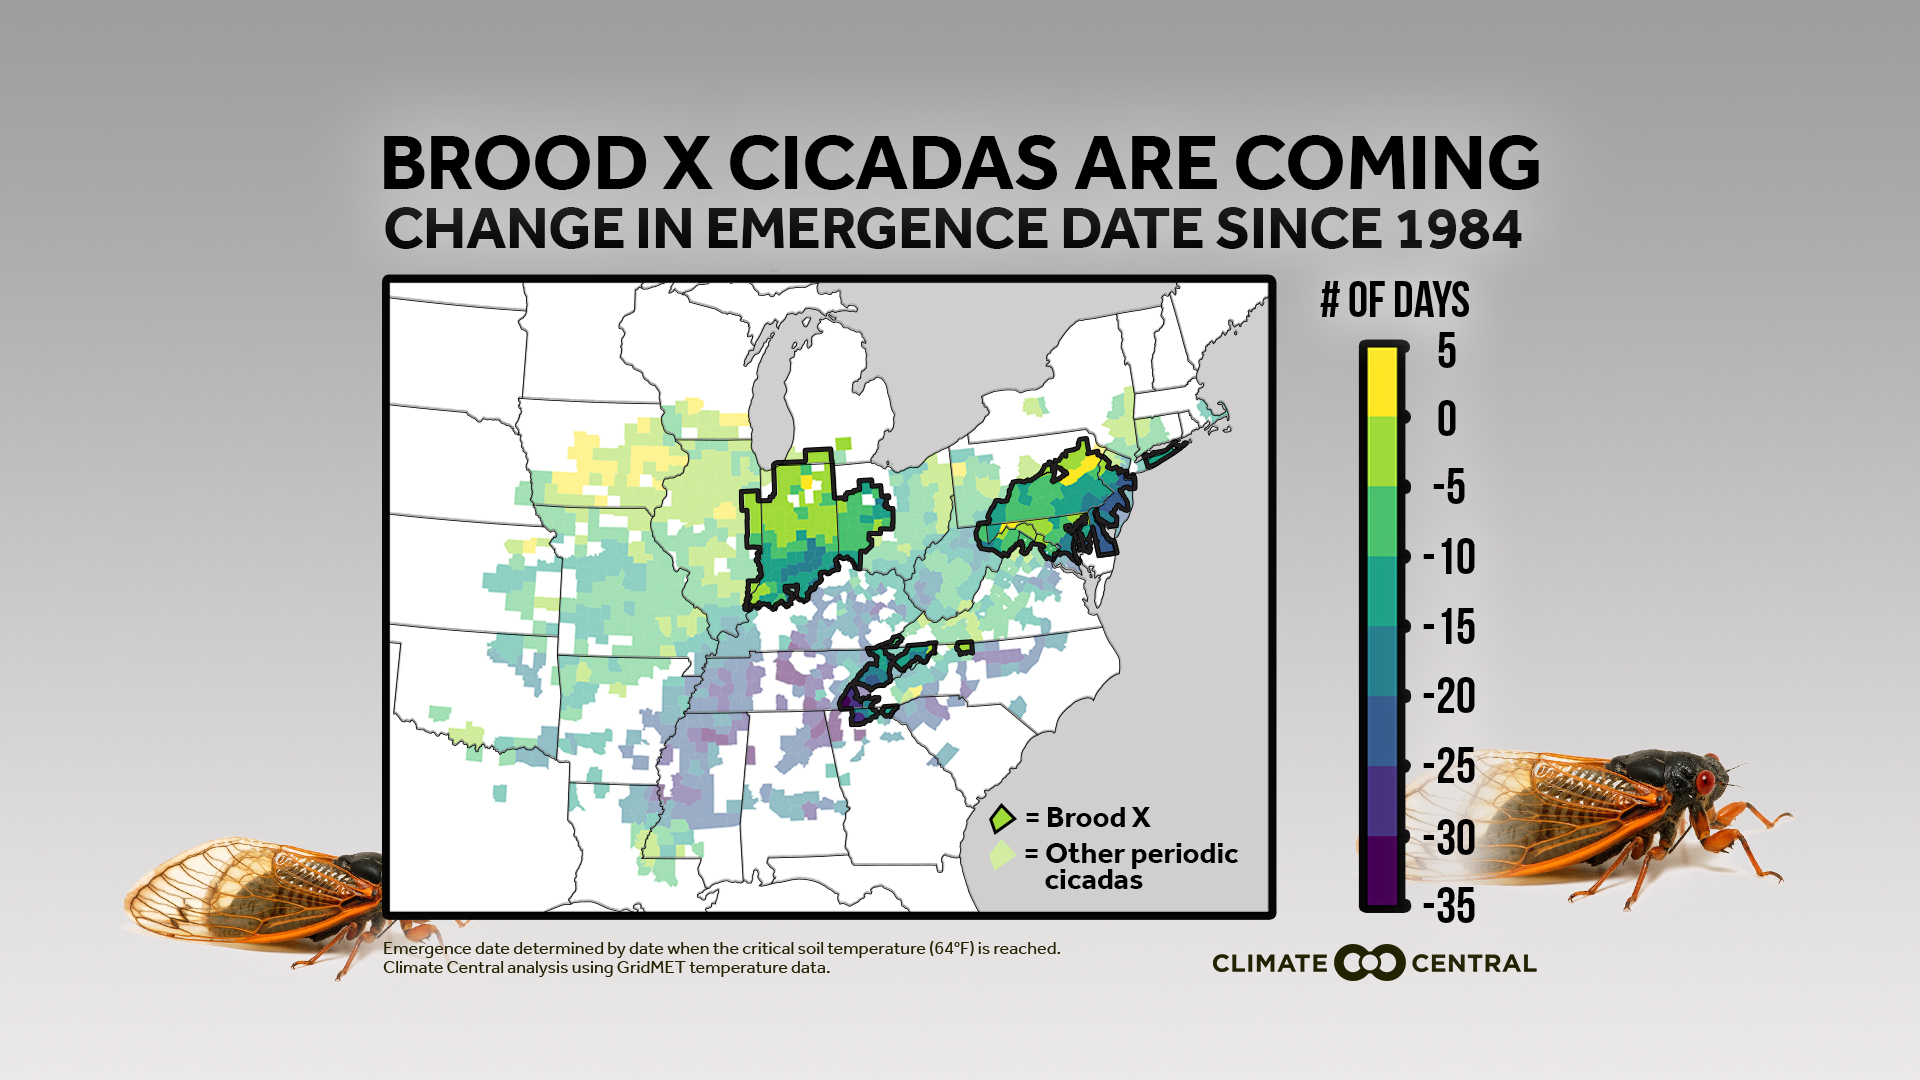
Research shows that the particular night of the periodical cicadas’ emergence depends on soil temperature. Cicada juveniles, or nymphs, emerge after a rainstorm when the soil temperature at 8 inches in depth exceeds approximately 64°F. The dependence on a specific soil temperature means that a changing climate can affect the emergence timing of periodical cicadas by a matter of days, months, and sometimes years. This is evident in several areas, including Washington, D.C., which saw a partial emergence of Brood X a full four years earlier in 2017. Shifts in timing can impact populations of periodical cicadas by forming straggler populations that can then become confused with the emergence of other broods.
How to Get Involved
To understand when Brood X can be expected to arrive, Climate Central has used data from NCEI’s Global Historical Climatology Network (GHCN) to predict how the expected arrival date may change due to the shift of temperatures. Use Climate Central’s visualization tool to create a graph of how Brood X emergence date has evolved in your area.
Beyond predictions, you can also track the soil temperature and moisture through NCEI’s network of over 124 monitoring stations that record this data hourly within the U.S. Climate Reference Network (USCRN). By looking at the most recent temperature readings at 20 centimeters, you can get an understanding of the approximate soil temperature of your region.

Once periodical cicadas have arrived in your area, you can join a citizen science effort to track the cicadas’ arrival this year. Mount St. Joseph University’s free Cicada Safari smartphone application creates a live map of emerging cicadas and helps researchers understand how Brood X has been impacted by climate change.


