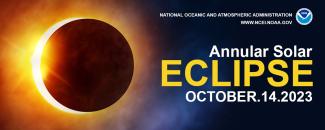
See if climatological averages will go your way or obscure the “Ring of Fire” this autumn

Your autumn days can include a free and spectacular show in the contiguous United States. Watch the sun temporarily cast a ringlike shadow upon the fall leaves as the annular eclipse path crosses from Oregon through Texas.
Weather can be unpredictable, but our U.S. Climate Normals-based interactive map has you covered. It takes into account average heat index, temperature, wind chill, and viewability and can be used to find the best spot in your region for viewing an annular eclipse.
NOAA’s National Centers for Environmental Information (NCEI) is proud to work with the North Carolina Institute for Climate Studies (NCICS), with whom we reviewed past cloud conditions for the October 14, 2023 eclipse event.
NCEI’s Datasets Keep on Giving
First produced in the 1950s, the U.S. Climate Normals house a large volume of data products. These products provide information about the historical climate conditions of thousands of locations across the United States.
Every decade, NCEI generates the official U.S. Climate Normals to meet our user community needs. These requirements are also fulfilled at the behest of the World Meteorological Organization (WMO) and National Weather Service (NWS).
The most recent U.S. Climate Normals cover the period from 1991 to 2020 and include hourly information on typical cloud cover, temperature, humidity, heat index, and hourly wind chill conditions.
Anyone can use the U.S. Climate Normals to meet their needs—be it a traveler finding out the average temperature of their destination, or a farmer planning when to plant their crops. In this instance, Climate Normals are invaluable for finding the best viewing spot for the 2023 annular eclipse in October.
NASA Eclipse Data
The annular eclipse would be difficult to view without knowing the direct path of annularity. Here’s where our friends at NASA come in.
Although they’re known for engineering giant spacecrafts, NASA’s 2023 Annular Solar Eclipse site also provided us with three pivotal pieces of information:
- The timing of the solar eclipse.
- Paths of annularity and obscuration levels (i.e., the percent of the sun obscured by the moon).
- The duration of the solar eclipse.
Don’t only thank NASA for all of the important news. Although they did some heavy lifting, these NASA data were extracted for each of NCEI’s hourly climate stations. NASA's eclipse data was combined with NCEI's climate information to determine typical cloudiness and other weather conditions during the annular eclipse at each station.
Planning how to dress on October 14 involves more than your protective eyewear. October conditions can be windy and chilly, so don’t leave your home unprepared. Visit the NCICS interactive map to search for an optimal viewing location by zip code.
Cloudiness data on our interactive map was converted from categorical conditions (i.e., clear skies, few clouds, scattered clouds, broken cloud coverage, and overcast conditions). These averages were then used to evaluate the unique “viewability” of a solar eclipse for each location and date/time. An additional adjustment was made to account for locations that don’t observe daylight saving time—we’re looking at you, Arizona.
More Coverage in October
See our next NCEI annular solar eclipse story in October—we’ll provide any necessary updates about average climate conditions before the moon crosses between the earth and the sun.


