March and the year to date were second warmest on record for the globe

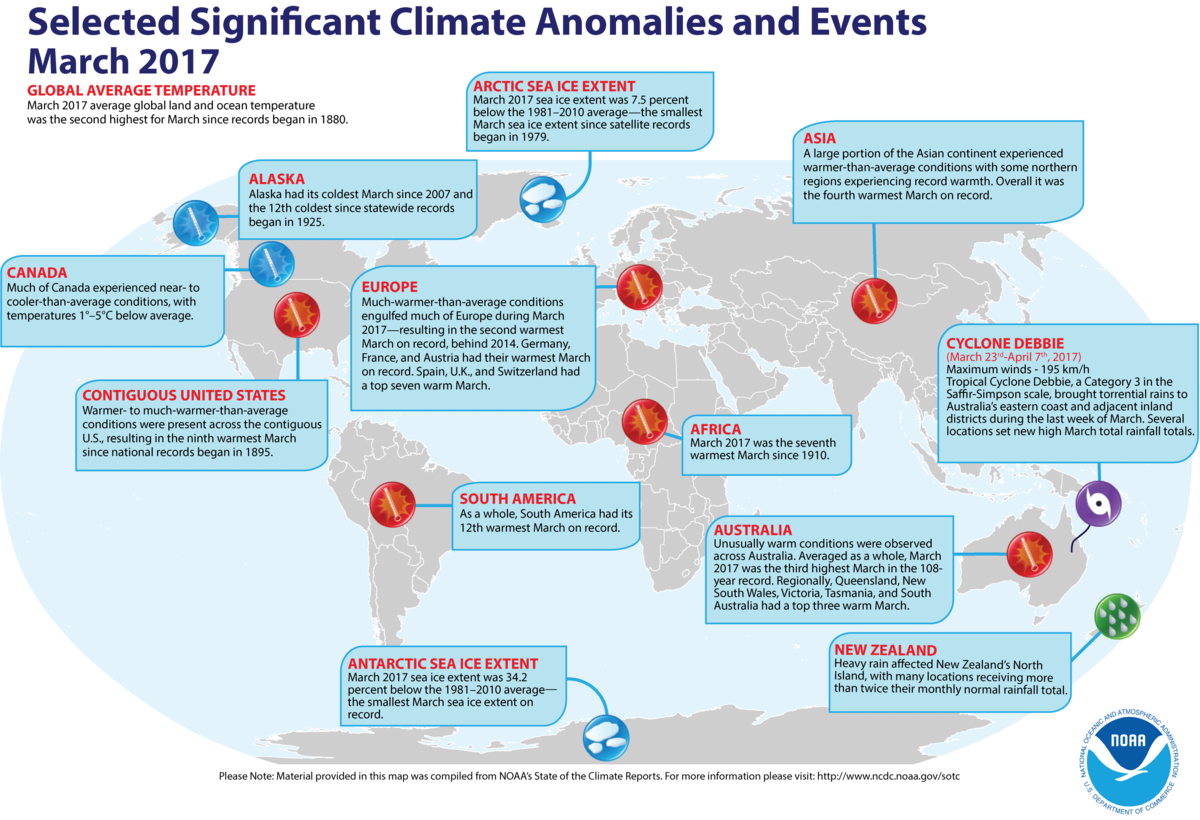
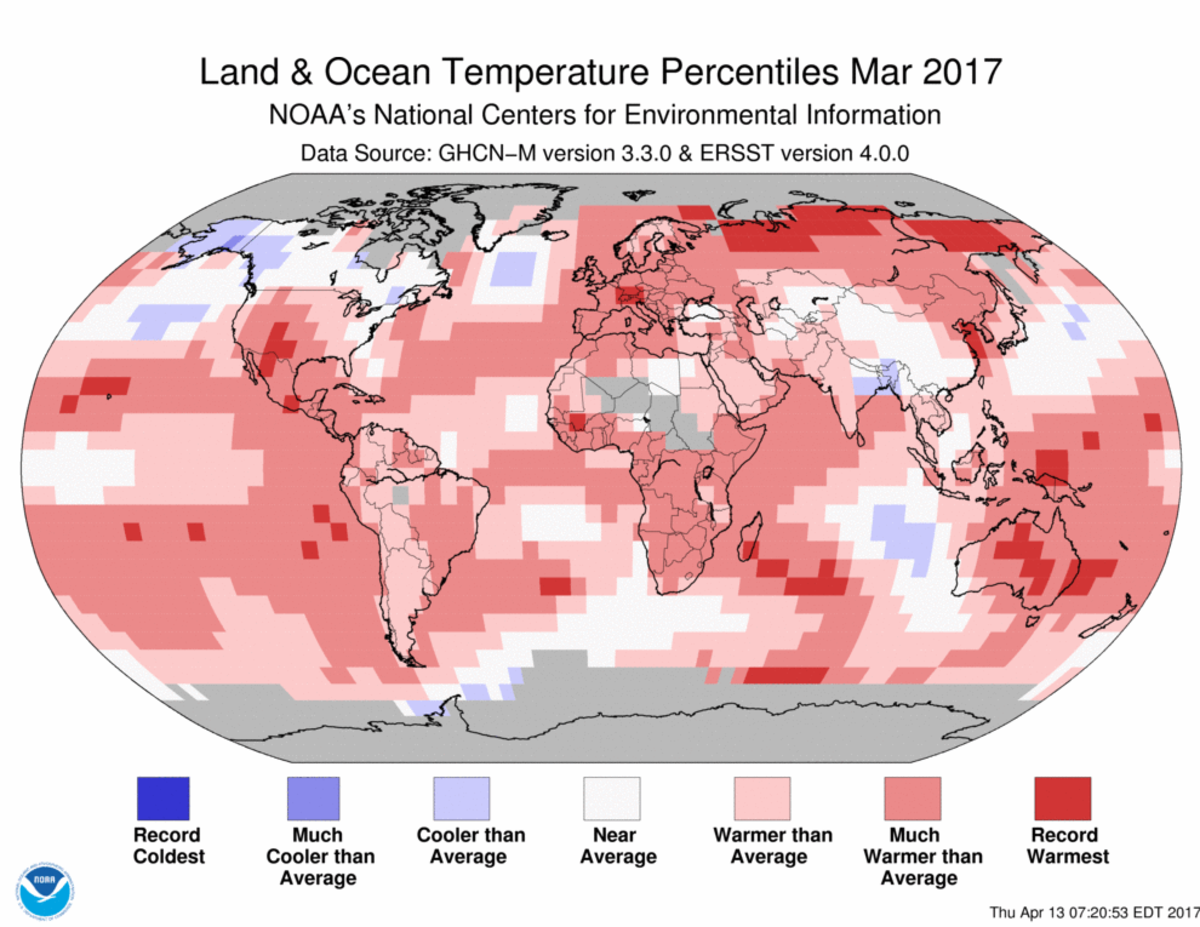
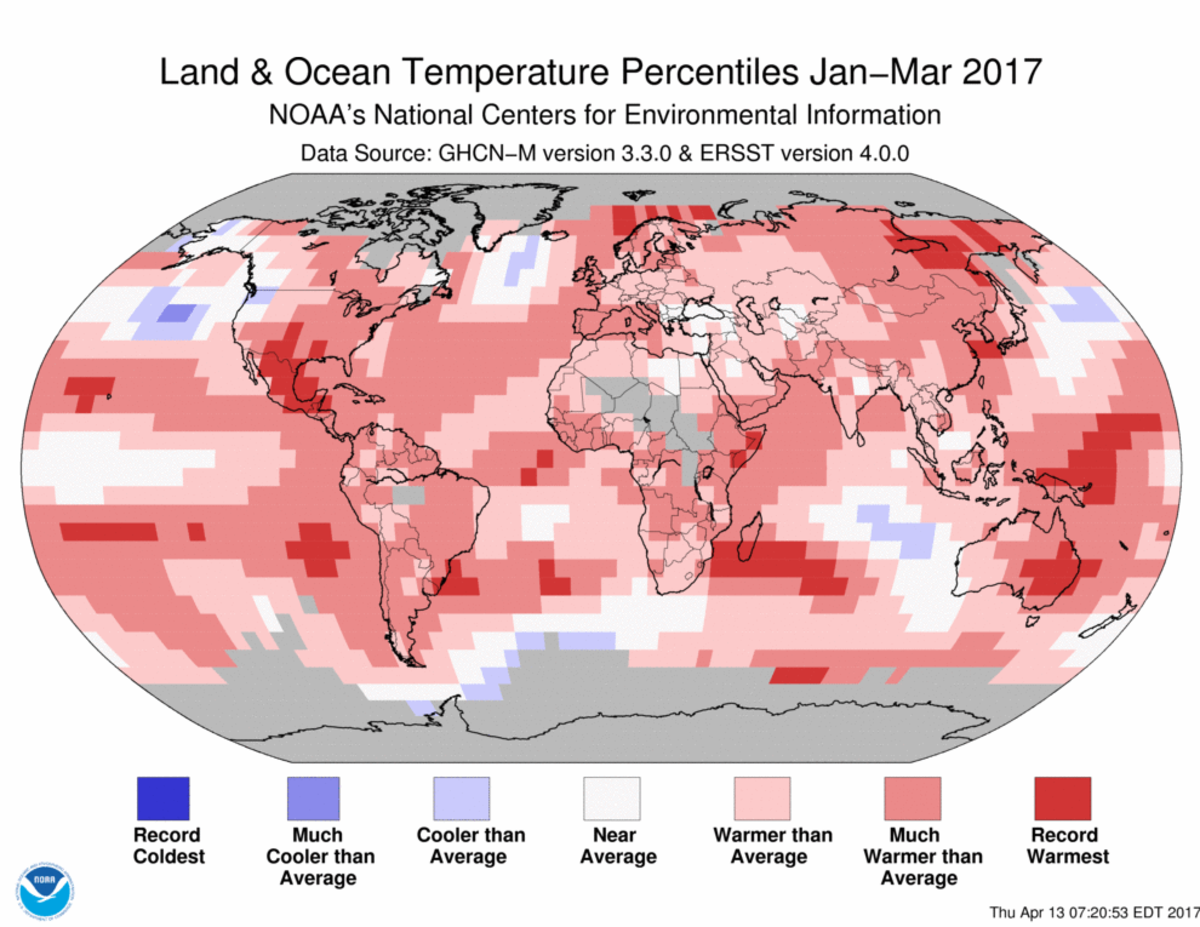
The globally averaged temperature over land and ocean surfaces for March 2017 was the second highest for the month of March in the NOAA global temperature dataset record, which dates back to 1880. The year-to-date global temperature was also second warmest on record.
This monthly summary is part of the suite of climate services NOAA provides to government, business, academia, and the public to support informed decision-making.
March Temperature
The March temperature across global land and ocean surfaces was 1.89°F above the 20th century average of 54.9°F. This was the second highest for March in the 138-year period of record, behind 2016 by 0.32°F.
This was the first time the monthly temperature departure from average surpassed 1.80°F (1.0°C) in the absence of an El Niño episode in the tropical Pacific Ocean.
The March globally averaged land surface temperature was 3.56°F above the 20th century average of 40.8°F. This value was also the second highest March land global temperature in the 1880–2017 record, trailing 2016 by 0.68°F.
March 2017 had the highest monthly global land temperature departure from average of any month since March 2016 and the third highest land monthly temperature departure among all months (1,647) on record.
The March globally averaged sea surface temperature was 1.28°F above the 20th century monthly average of 60.7°F—the second highest global ocean temperature for March in the record, behind the record year 2016 by 0.18°F.
This was the highest global ocean temperature departure from average since October 2016 (+1.30°F).
March Snow Cover and Sea Ice
According to data from NOAA analyzed by the Rutgers Global Snow Lab, the Northern Hemisphere snow cover extent during March was near average at 20,000 square miles below the 1981–2010 average. This was the 24th smallest value in the 51-year period of record. The North American snow cover extent was the 20th smallest on record, while the Eurasian snow cover extent was near the middle of the record.
The average Arctic sea ice extent for March was 452,000 square miles (7.5 percent) below the 1981–2010 average. This was the smallest March extent since records began in 1979 and 23,000 square miles smaller than the previous record set in 2015, according to an analysis by the National Snow and Ice Data Center based on data from NOAA and NASA.
The Antarctic sea ice extent for March was 580,000 square miles (34.2 percent) below the 1981–2010 average. This was the smallest March Antarctic sea ice extent since records began in 1979 and 210,000 square miles smaller than the previous record set in 2006.
Year-to-Date (January–March) Temperature
The year-to-date temperature across global land and ocean surfaces was 1.75°F above the 20th century average of 54.1°F. This was the second highest for January–March in the 1880–2017 record, behind the record year of 2016 by 0.32°F.
The year-to-date globally averaged land surface temperature was 3.15°F above the 20th century average of 38.5°F. This was also the second highest for January–March in the 138-year record, behind 2016 by 0.56°F.
The year-to-date globally averaged sea surface temperature was 1.22°F above the 20th century average of 60.6°F. This was the second highest for January–March in the record, behind 2016 by 0.25°F.
For a more complete summary of climate conditions and events, see our March 2017 Global Climate Report.


