Second-warmest November and year-to-date; third-warmest September-November for the globe

The November 2020 globally averaged temperature departure from average over land and ocean surfaces was the second highest for the month of November in the 141-year NOAA global temperature dataset record, which dates back to 1880.
This monthly summary, developed by scientists at NOAA National Centers for Environmental Information, is part of the suite of climate services NOAA provides to government, business, academia and the public to support informed decision-making.
November 2020
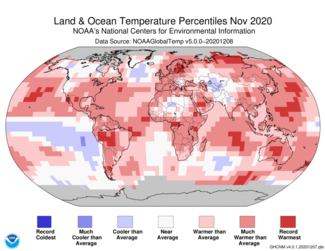
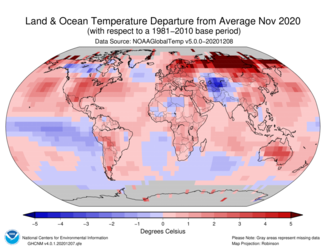
The November 2020 global land and ocean surface temperature was 1.75°F (0.97°C) above the 20th-century average of 55.2°F (12.9°C). This was the second highest for November in the 141-year record. Only November 2015 had a higher temperature departure (+1.82°F / +1.01°C).
- November 2020 marked the 44th consecutive November and the 431st consecutive month with temperatures, at least nominally, above the 20th-century average.
- The 10 warmest Novembers have all occurred since 2004. The five warmest Novembers have occurred since 2013.
- The global land surface temperature for November 2020 was 3.19°F (1.77°C) above average--the highest global land surface temperature departure for November on record.
- The Northern Hemisphere had its warmest November on record. Meanwhile, the Southern Hemisphere’s land and ocean surface temperature departure from average for November 2020 was the ninth highest on record.
- Oceania had its warmest November on record, while Europe and South America had their second- and third-warmest November, respectively.
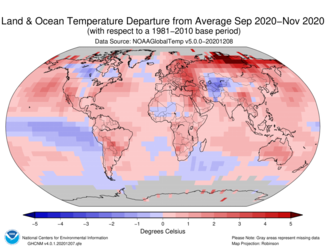
- The most notable temperature departures from average during November 2020 were present across parts of the contiguous U.S., northern Europe, northern Russia, Australia, central and southern South America, the North Pacific Ocean, and the Bering Sea.
Snow and Sea Ice
According to data from NOAA and analysis by the Rutgers Global Snow Lab, the Northern Hemisphere snow cover extent during November was 780,000 square miles above the 1981-2010 average and the 12th-largest November snow cover extent in the 55-year period of record. The North American snow cover extent was the 13th largest on record for November, while Eurasia had its 17th-largest November snow cover extent on record.
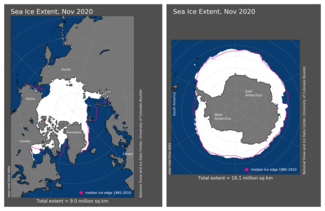
The November average Arctic sea ice extent was the second smallest for November on record at 660,000 square miles (16.0 percent) below the 1981-2010 average, according to analysis by the National Snow and Ice Data Center (NSIDC) using data from NOAA and NASA. This was only 127,000 square miles above the record low set in 2016. November 2020 marked the 21st consecutive November with below-average Arctic sea ice extent. According to the NSIDC, below-average sea ice extent was observed across the Barents, Kara, and Chukchi seas.
Antarctic sea ice extent during November 2020 was 90,000 square miles above average, tying with 1980 and 1984 as the 11th-largest November Antarctic sea ice extent in the 42-year satellite record.
September-November 2020
The September-November period is defined as the Northern Hemisphere's meteorological fall and the Southern Hemisphere's meteorological spring.
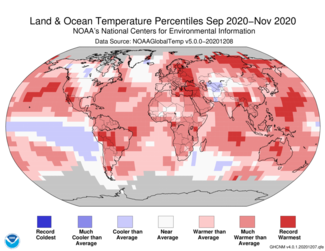
The seasonal global land and ocean surface temperature for September-November 2020 was the third highest in the 141-year record, with a temperature departure from average of 1.64°F (0.91°C) above the 20th-century average of 57.1°F (14.0°C). The three-month periods of September-November 2015 and 2019 were warmer.
- This was the second-warmest autumn for the Northern Hemisphere, behind autumn 2015 by only 0.02°F (0.01°C). The Southern Hemisphere had its ninth-warmest (tied with 2012) spring on record.
- During the three-month period of September-November 2020, South America, Europe, and Oceania had their warmest such period on record, while Asia had its second-warmest such period on record.
- Record warm temperatures during the season were observed across parts of the north and western Pacific Ocean, Atlantic and Indian oceans, as well as across parts of both North and South America, eastern Europe, Asia, and Australia. No land or ocean areas had record cold September-November temperatures.
January-November 2020
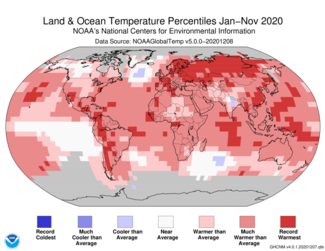
The year-to-date global land and ocean surface temperature was also the second highest in the 141-year record at 1.80°F (1.00°C) above the 20th-century average of 57.2°F (14.0°C). This value is only 0.02°F (0.01°C) less than the record set in 2016.
- The Northern Hemisphere had its warmest January-November period since global records began in 1880, surpassing the previous record set in 2016 by 0.09°F (0.05°C). The Southern Hemisphere had its fifth-warmest such period on record.
- Europe and Asia had their warmest January-November period on record. South America, Oceania and the Caribbean region had a January-November temperature that ranked as the second highest on record.
- Record warm January-November temperatures were present across much of northern Asia and across parts of southeastern Asia, Europe, northern Africa, southern North America, South America as well as the Atlantic, Indian and Pacific oceans.
- According to a statistical analysis done by NCEI scientists, the year 2020 is very likely to rank among the three warmest years on record.
For a more complete summary of climate conditions and events, see our November 2020 Global Climate Report.


