

From sunny warmth to sub-zero cold blasts, high variability is at the heart of U.S. climate conditions during February. One of the highlights of the month, the tradition of Valentine’s Day, isn’t exactly set up with the ideal climate for Cupid to be out and about across most of the country. Across the Lower 48, normal high temperatures typically range from the 70s to the 20s and normal lows typically range from the 60s to below 0s on February 14. In honor of Valentine’s Day, we take a look at typical February climate conditions and climate normals for several lovely U.S. locations.
February U.S. Climate Conditions
But, it’s not just Valentine’s Day that often sees drastically different weather conditions from year-to-year. Throughout the entire month of February we often endure atmospheric swings as meteorological winter comes to a close in the Northern Hemisphere.
Temperatures
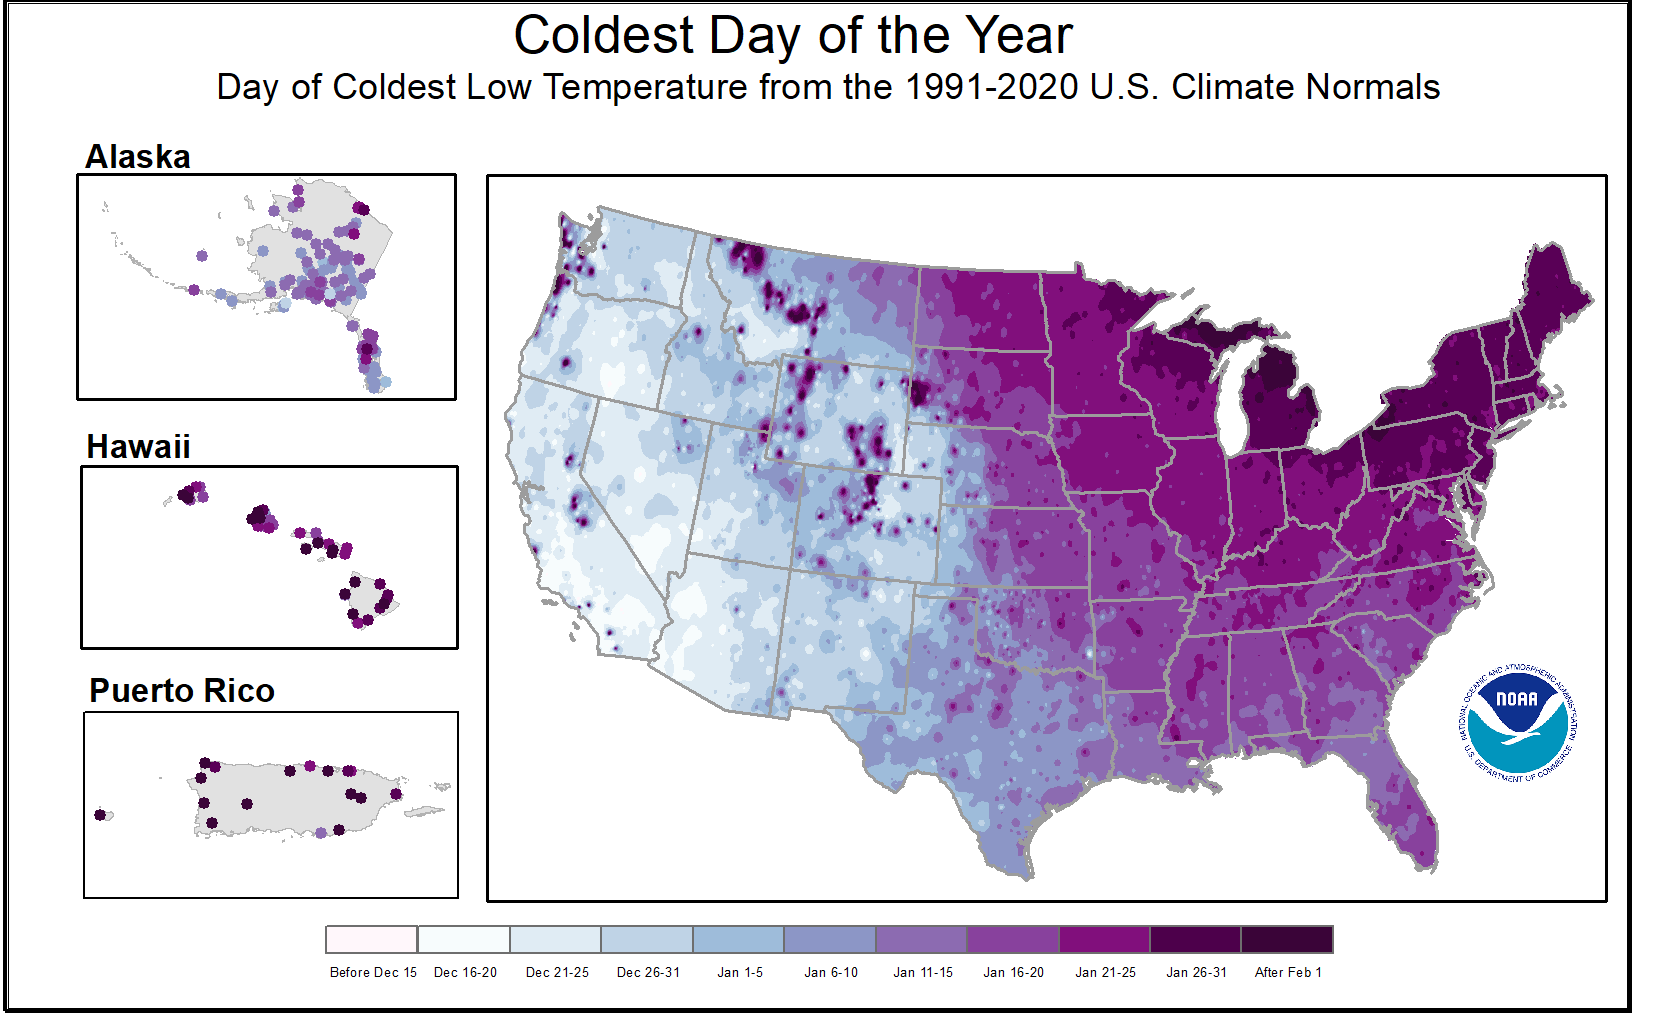
Climatologically speaking, February is the third coldest month of the year—with December and January typically being colder. Despite this, areas around the Great Lakes typically see their coldest days in February, according to the updated 1990-2020 U.S. Climate Normals. The contiguous United States average temperature is around 34°F for the month, based on data from the 127-year record in the U.S.
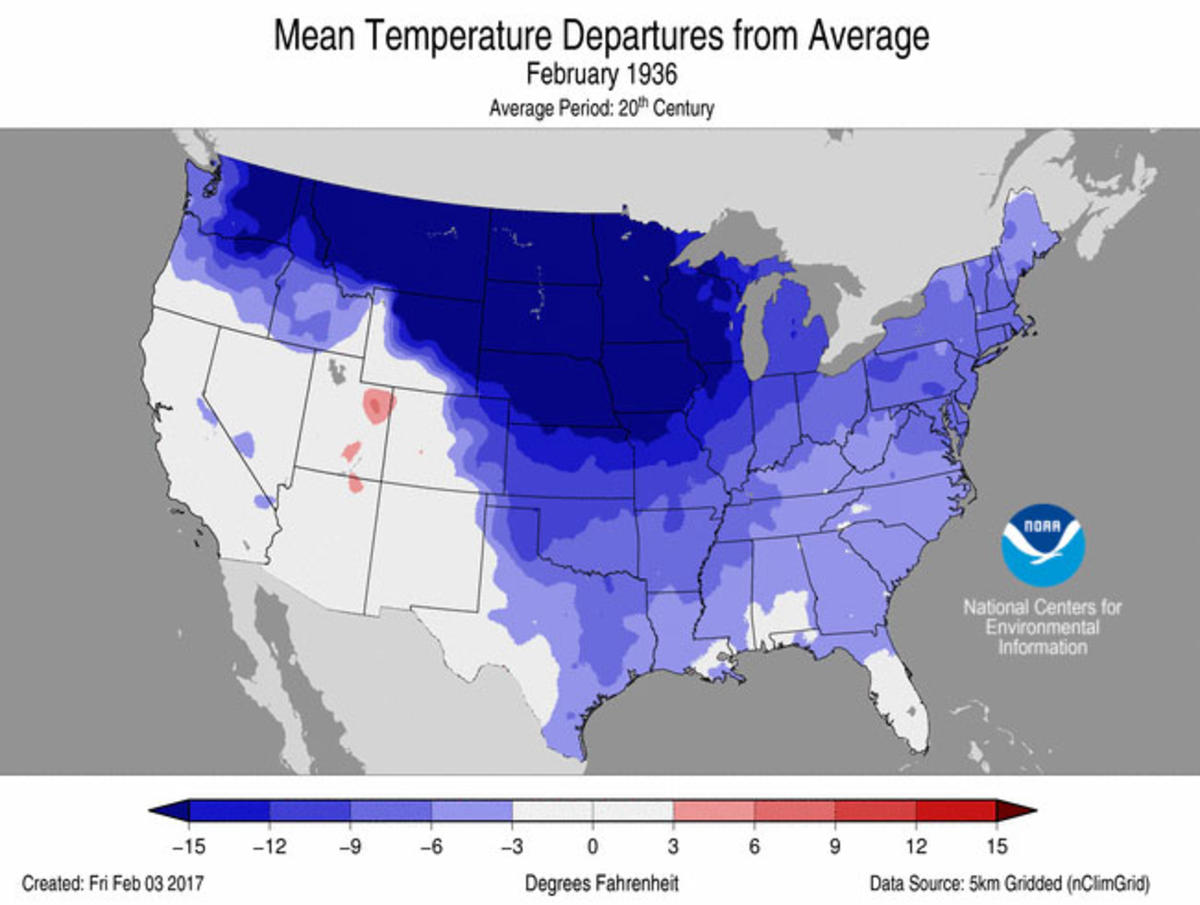
The coldest February on record for the Lower 48 occurred in 1936 when the average temperature for the contiguous United States was a frigid 25.2°F. During that month, every state except Utah had a temperature below the 20th century average. Eight states across the Northwest and Northern Plains were record cold. The statewide average temperature for North Dakota was a bone-chilling 14.1°F below zero—26.0°F below average—and the average nighttime temperature for the state was a whopping 23.4°F below zero. February 1936 is the coldest month of any month on record for North Dakota. And, North Dakota’s average temperature of −14.1°F that month remains the all-time coldest monthly temperature for any state in our 128-year period of record.
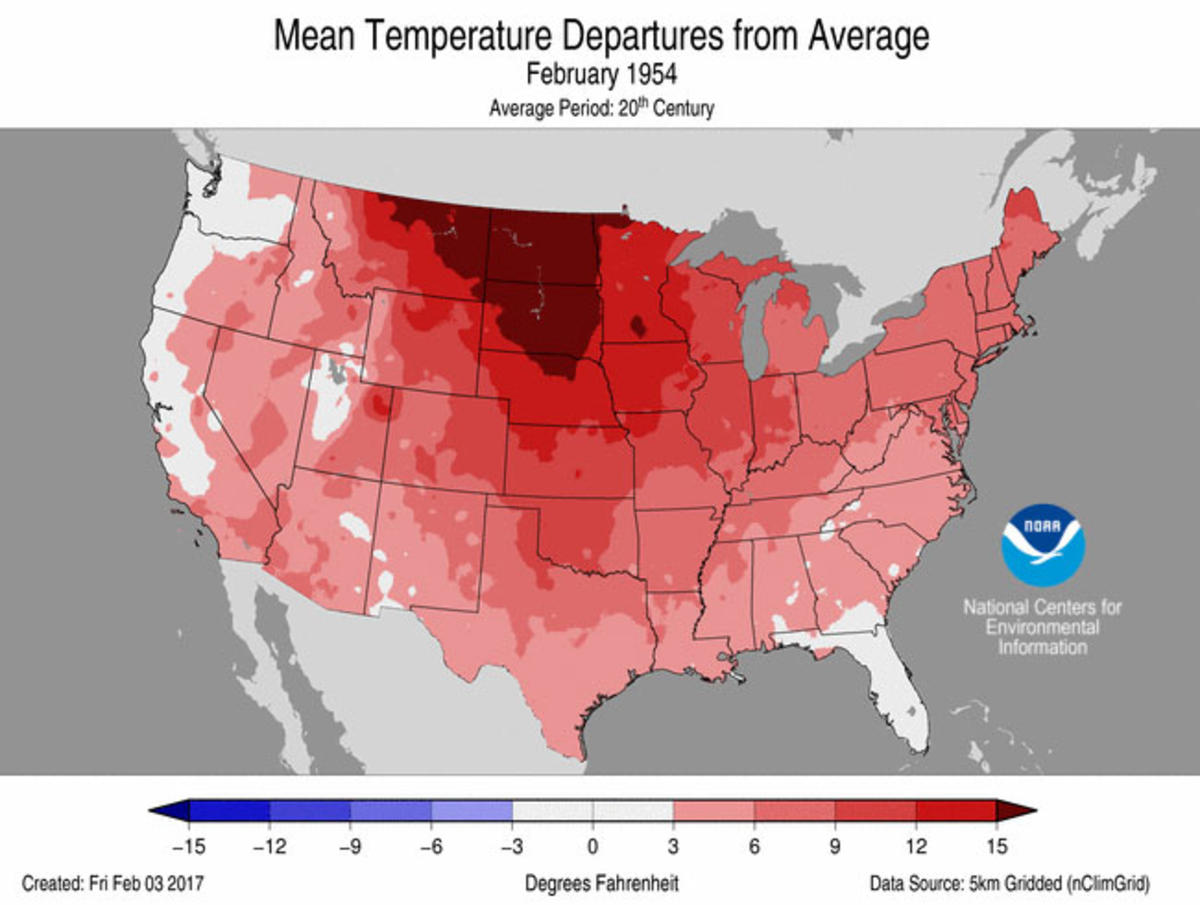
Conversely, the contiguous United States saw its warmest February on record in 1954 with an average temperature of 41.4°F. Every state in the lower 48 was warmer than average in February 1954, and seven states across the Great Plains were record warm. The warmest state, compared to its own history, was North Dakota with a temperature 17.7°F above average—43.7°F warmer than its coldest February in 1936.
Since 1895, the contiguous U.S. temperature has increased at a rate of 2.9°F per century. When looking at the country’s entire period of record, February is warming faster than any other month of the year.
Snow Cover
During an average February, 1.2 million square miles of the contiguous United States—about 4.5 times the size of Texas—is covered in snow. Since 1967, when satellite records began, the largest February snow cover extent for the Lower 48 occurred in 1978. That month, 1.9 million square miles or 64% of the contiguous United States was covered in snow. The smallest February snow cover extent for the Lower 48 occurred in 1992 when just 0.8 million square miles or 29% of the contiguous United States was covered in snow.
According to the Regional Snowfall Index, several large snow storms have impacted the United States during February. Some of these historic storms include:
- The Valentine’s Day Storm of 1940
- The Great Blizzard of 1978
- The President’s Day Snowstorm of 1979
- The Megalopolitan Storm of 1983
- The President’s Day Blizzard of 2003
- The Groundhog Day Blizzard of 2011
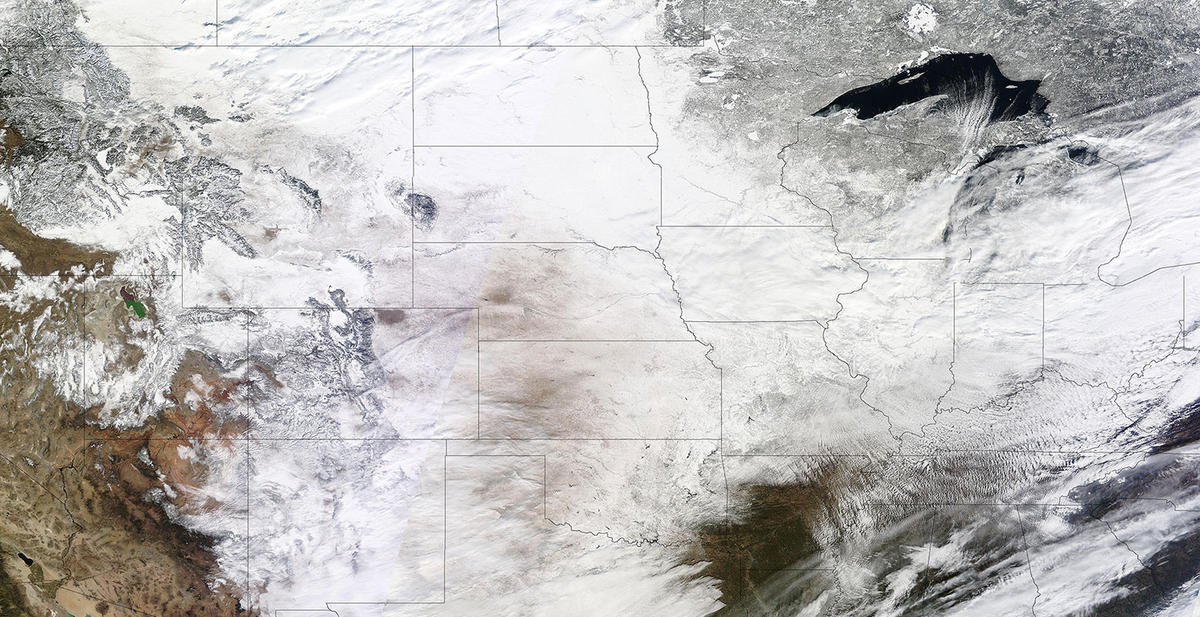 A blanket of white covered the central and northeastern United State on February 2, 2011, as the Groundhog Day Blizzard dumped more than 5 inches of snow on 22 states
Courtesy of NASA
Tornadoes
Tornado activity varies widely during February, with some years seeing a very active month and others seeing few tornadoes. The most active February occurred in 2008 when the country had over 140 confirmed tornado reports. The least active February occurred in both 1982 and 2010, when only one tornado was reported.
![]()
The average number of tornado-related fatalities during February is the highest of any month—13. This is due in part to the “Super Tuesday” outbreak of 2008; the most significant tornado outbreak to impact the country during February. On February 5–6, 86 tornadoes touched down across a large portion of the south-central United States. Tennessee and Kentucky were the hardest hit with 50 tornadoes observed across the two states. Of the 86 tornadoes, 17 were classified as “strong” EF-2 tornadoes, 5 as “severe” EF-3 tornadoes, and 5 as “devastating” EF-4 tornadoes on the Enhanced Fujita Tornado Scale.
February 14 Climate Normals for Lovely U.S. Locations
In such a geographically and climatologically diverse country, average conditions can vary from day to day and from place to place across the United States. From Kissimmee’s warmth to a frigid Wildrose, the graphic below shows the normal average temperature on February 14 for 16 locations with Valentine-themed names, according to our daily 1991-2020 Climate Normals data.

While our Climate Normals provide average temperatures throughout the United States, the actual conditions this Valentine’s Day may vary widely based on weather and climate patterns. For prediction of your actual local daily temperature, check out your local forecast office on Weather.gov.


