Early 21st century U.S. drought ranks as one of the most severe in 120 years

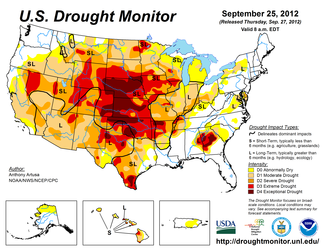
At the beginning of the 21st century, several regional droughts were plaguing parts of the contiguous United States. By 2012, these droughts had combined into a national-scale event the likes of which hadn’t been seen in decades. With two-thirds of the Lower 48 states in drought by the end of September, many began to speculate that it was as severe as the episodes of the 1930s and 1950s. But how did this early 21st-century drought really compare to those two previous droughts? NCEI scientist and drought expert, Richard Heim, set out to answer that very question.
In his paper, A Comparison of the Early Twenty-First Century Drought in the United States to the 1930s and 1950s Drought Episodes published in the Bulletin of the American Meteorological Society, Heim found that the 1998–2014 drought shared several characteristics with the droughts of the 1930s and 1950s. Using the Palmer Drought Index, Standardized Precipitation Index, and U.S. Climate Extremes Index, Heim was able to provide a historical perspective on the early 21st-century drought's intensity, extent, and duration.
What defines drought?
The United States is divided into 344 “climate divisions” or locations. Using the Palmer Drought Index, a location is in drought when the Index goes negative, that is, demand for water exceeds the supply. A “stretch” of drought is the length of time the Index is in the negative for that location. The stretch of drought at that location ends when the Index goes to zero or “wet.”
On the other hand, a drought “episode” refers to the country as a whole. A drought episode occurs when 10 percent or more of the country is in drought. This percentage is determined by adding up the area of all climate divisions (locations) in the country that are in drought and dividing by the country’s total area. If 10 percent or more of the country’s total area is in drought, then a drought episode is in place.
In his drought study, Heim identified 13 major “drought episodes” that had affected the country between 1900 and 2014. Of these, 11 covered at least 10 percent of the contiguous United States for 90 percent or more of their duration. The three longest drought episodes, perhaps not surprisingly, took place between July 1949 and September 1957 (1950s drought), between July 1928 and May 1942 (1930s Dust Bowl drought), and between June 1998 and December 2014 (early 21st-century drought).
How widespread were the droughts?
Each of these three drought episodes covered at least 60 percent of the Lower 48 States at their peak and lasted 99 months or longer. According to Heim, “The 1930s drought was the most expansive at its peak, but the 1950s drought had the greatest average drought area, indicating that it was the largest for the longest period.” (Note: At the time the analysis was done—in early 2015—the 21st century drought was still ongoing.)
How variable were the droughts?
The variability of moisture conditions within each drought episode was also examined. Heim found that the early 21st-century drought had a greater spatial variability in moisture conditions than the earlier episodes, meaning there was a greater occurrence of wet areas mixed in with the dry areas. The early 21st-century drought also had a greater variability in month-to-month moisture conditions than the other two, with the 1950s having the smallest monthly variability—in the 1950s, when a region went into drought, it tended to stay in drought longer.
How severe were the droughts?
In addition to areal coverage, Heim also looked at the hydrological impacts of the three drought episodes. During each drought episode, large parts of the country were in drought, but other parts of the country were experiencing wet conditions. Using this criteria, “the 1998–2014 drought period had a ‘wetter’ character compared to the 1950s and 1930s drought periods,” Heim noted. And, while the 1930s and 1950s saw more long-duration intense dry spells, the early 21st-century drought trended toward shorter bursts of extreme dryness. The 21st-century drought also saw warmer temperatures than the other two episodes.
How long did the droughts last?
All climate divisions, or locations, across the country were examined for each of the three drought episodes. When the longest stretches of drought at each location were averaged together, the longest stretch of drought for the 21st century episode averaged 37.3 months, with the peak of duration occurring in November 2003. For the 1930s drought episode, the average longest stretch was 38.4 months, peaking in March 1935. And, for the 1950s drought episode, the average longest stretch was 56.0 months, peaking in February 1957. When the individual drought lengths at each location are grouped by length and examined, the 21st-century episode had more short-term droughts, lasting just 1 to 3 months, than the other two episodes and fewer long-term droughts lasting 1– 2 years, while the 1950s drought episode had more half-year droughts, lasting 4–6 months each, and fewer 1-year droughts, lasting 7–12 months, than the other two.
How do these droughts affect our future?
In the past, response to drought has been reactive, in terms of crisis management, rather than proactive, in terms of risk management. Scientists are learning valuable information by studying the different aspects of historical droughts as well as past and ongoing changes in climate that both cause and affect drought duration and area. This information can be used proactively to improve societal preparedness and reduce the economic and societal damage caused by future drought events.


