
The contiguous United States had its 2nd warmest year-to-date and a warmer than average June

The June average temperature for the contiguous U.S. was 70.3°F, 1.9°F above the 20th century average, and tied as the 20th warmest June in 123 years of record keeping. Much-above- average temperatures were observed across the Southwest, while parts of the Southeast, Lower Mississippi Valley, and Ohio Valley were cooler than average. The year-to-date average temperature for the contiguous U.S. was 50.9°F, 3.4°F above average. This was ranked as second warmest on record, slightly warmer than the same period in 2006 and 1.2°F cooler than the record set in 2012.
The June precipitation total was 3.01 inches, 0.08 inch above the 20th century average, and ranked near the middle value in the 123-year period of record. Below-average precipitation in the Southwest, Central Rockies, and Great Plains was offset by above-average precipitation in the Deep South and parts of the Great Lakes. Tropical Storm Cindy made landfall near the Louisiana/Texas border on June 22, contributing to the above-average precipitation in the region. The year-to-date precipitation total for the contiguous U.S. was 17.86 inches, 2.55 inches above average, the sixth wettest on record and wettest since 1998.
Near-record number of billion-dollar disasters for year-to-date: From January through June, the U.S. experienced nine billion-dollar weather and climate disasters, trailing only 2011 and 2016, which each had 10 events. The 2017 events included two floods, a freeze, and six severe storms, collectively causing 57 fatalities.
See all June and year-to-date U.S. temperature and precipitation maps.
This monthly summary is part of the suite of climate information services NOAA provides to government, business, academia, and the public to support informed decision-making.

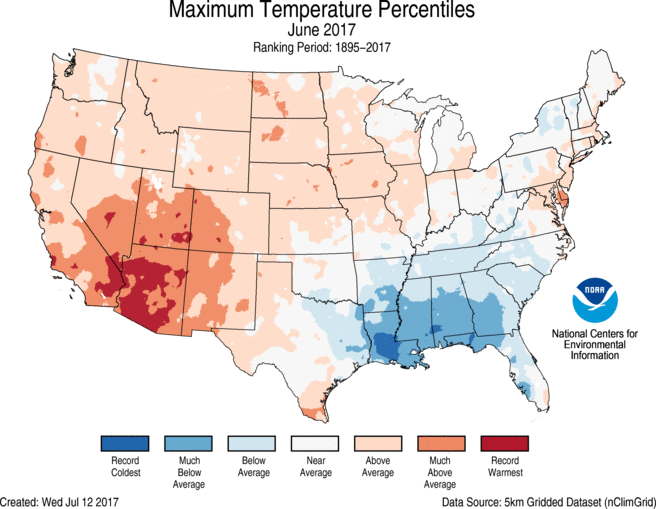
June Temperature

-
Above-average temperatures were observed for locations from the West Coast to Rocky Mountains, with parts of the Great Plains, Great Lakes, and East Coast also warmer than average. In the Southwest, much-above-average temperatures were driven by a record-breaking heat wave in mid-June. No state was record warm, but Arizona had its second warmest June with a record hot statewide-averaged June maximum temperature of 97.3°F.
-
Below-average temperatures were observed in parts of the Southeast, Lower Mississippi Valley, and Ohio Valley. The below-average temperatures were mostly due to much-below-average maximum temperatures, particularly along the Gulf Coast where record and near-record precipitation kept afternoon highs below average. No state was record cold.
June Precipitation

-
Below-average precipitation was observed across parts of the Great Basin, Northern and Central Plains, and Mid-Atlantic. Nebraska had its second driest June and Maryland had its seventh driest. Some regions in the Southwest received no precipitation in June, which is typical of early summer. No state was record dry.
-
Above-average precipitation fell across the Gulf Coast and from the Great Lakes to northern Northeast. Tropical Storm Cindy dropped heavy rain and caused significant flooding across parts of the Southeast to Midwest as the storm tracked northward after making landfall near the Louisiana/Texas Coast on June 22. Alabama, Florida, Louisiana, Mississippi, and Vermont were each much wetter than average. No state was record wet.
-
According to the June 27 U.S. Drought Monitor report, 8.0 percent of the contiguous U.S. was in drought, up about 2.8 percent compared to the end of May. Drought improved across parts of the Southern Plains and Southeast. In the Southeast, drought conditions were nearly eradicated where torrential rainfall was observed over the past month, particularly along the Gulf Coast. Drought conditions expanded and worsened across the Northern to Central Plains where short-term and long-term precipitation deficits have been observed. Outside of the contiguous U.S., drought worsened for parts of Hawaii and western to central Alaska. Abnormally dry conditions improved in eastern Alaska.
Year-to-Date (January–June) Temperature

-
Above-average temperatures spanned the nation for the first half of 2017 with only parts of the Northwest cooler than average. Much-above-average temperatures were observed for most locations from the Rockies to East Coast mostly due to record and near-record warmth early in the year. Florida, Georgia, North Carolina, and South Carolina observed their warmest January–June on record.
Year-to-Date (January–June) Precipitation

-
Above-average precipitation was observed for a large part of the contiguous U.S. with much-above-average precipitation observed for 12 states across the West, Central Plains, and Great Lakes to Northeast. Idaho and Michigan each had record high precipitation totals for the first half of 2017.
-
Below-average precipitation was observed for the Northern Plains. North Dakota had only 5.40 inches of precipitation, 61 percent of average. This was the fourth driest year-to-date for the state and the driest since 1936.
Weather and Climate Extremes

-
From January through June, the U.S. experienced nine billion-dollar weather and climate disasters, trailing only 2011 and 2016 which each had 10 events. The 2017 events included two floods, a freeze, and six severe storms, collectively causing 57 fatalities.
-
The U.S. has sustained 212 weather and climate disasters since 1980 where overall damages/costs reached or exceeded $1 billion (including CPI adjustment to 2017). The total cost of these 212 events exceeds $1.2 trillion.
-
The U.S. Climate Extremes Index (USCEI) for the year-to-date was the third highest value on record at more than double the average. The USCEI is an index that tracks extremes (falling in the upper or lower 10 percent of the record) in temperature, precipitation, drought, and land-falling tropical cyclones across the contiguous U.S. On the national scale, extremes in warm daytime and nighttime temperatures, one-day precipitation totals, days with precipitation, the spatial extent of wet conditions, and land-falling tropical cyclones contributed to the elevated USCEI.


