U.S. hit with 3 billion-dollar disasters in first 3 months of 2018
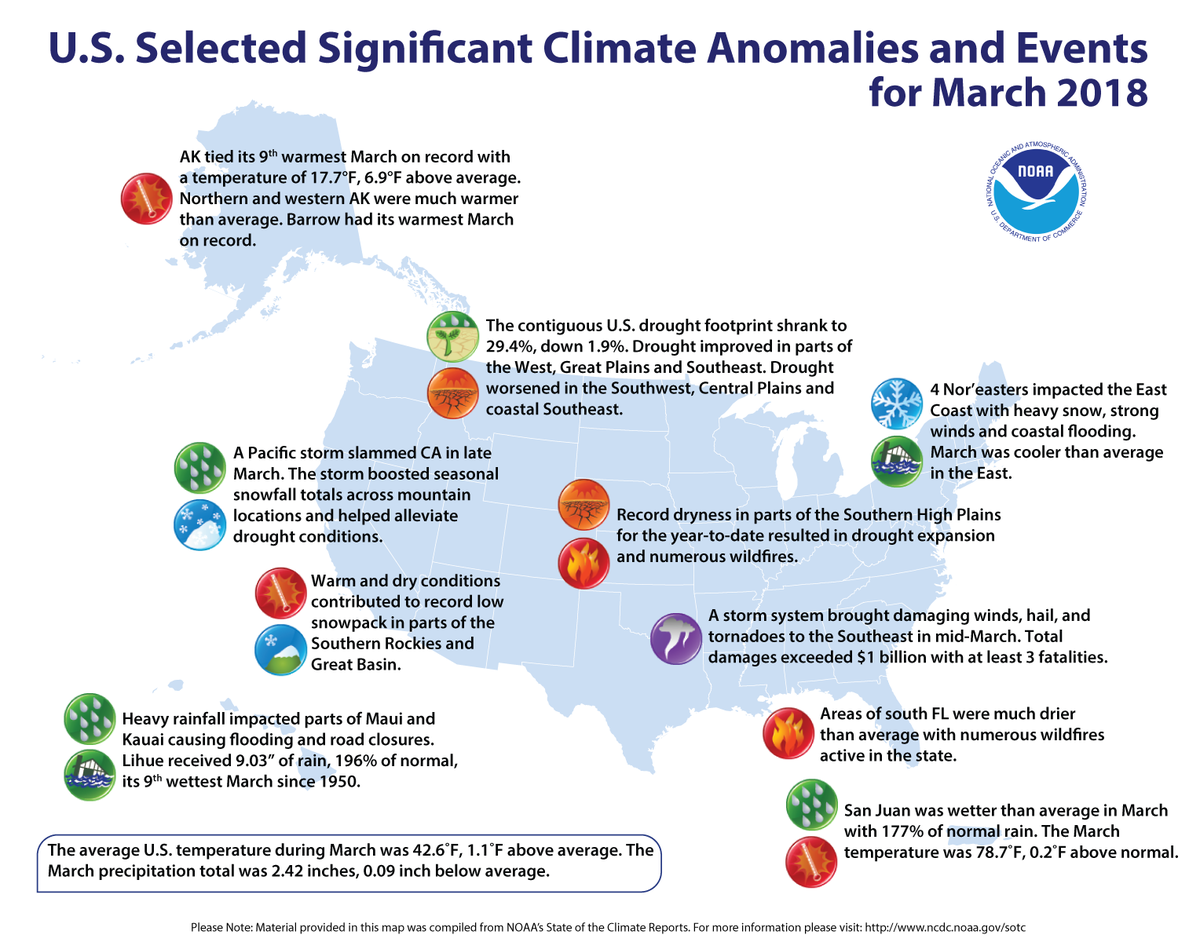
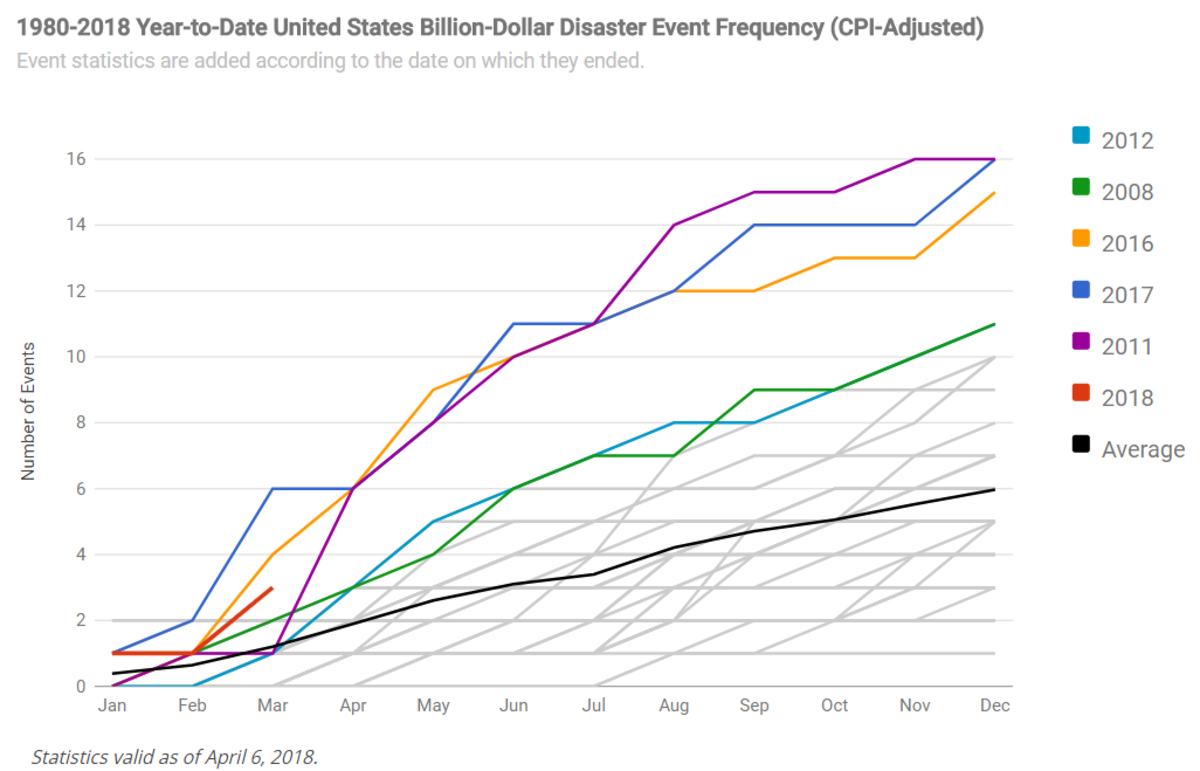
In the first three months of 2018, there have been three weather and climate disaster events with losses exceeding $1 billion each across the U.S. These events included a severe storm event in the Southeast and two winter storm events in the central and eastern U.S. Overall, these events resulted in the deaths of at least 34 people and had significant economic effects on the areas impacted.
During March, the average contiguous U.S. temperature was 42.6°F, 1.1°F above the 20th century average. This ranked near the median value in the 124-year period of record. The year-to-date (January–March) average contiguous U.S. temperature was 36.8°F, 1.6°F above average, ranking among the warmest third of the record. This was the coldest start to a year since 2014 for the nation. The March precipitation total for the contiguous U.S. was 2.42 inches, 0.09 inch below average, and ranked near the median value in the 124-year period of record. The year-to-date precipitation total was 7.13 inches, 0.17 inch above average, also ranking near the median value.
This monthly summary from NOAA’s National Centers for Environmental Information is part of the suite of climate services NOAA provides to government, business, academia and the public to support informed decision-making.
See all March U.S. temperature and precipitation maps.
March Temperature
-
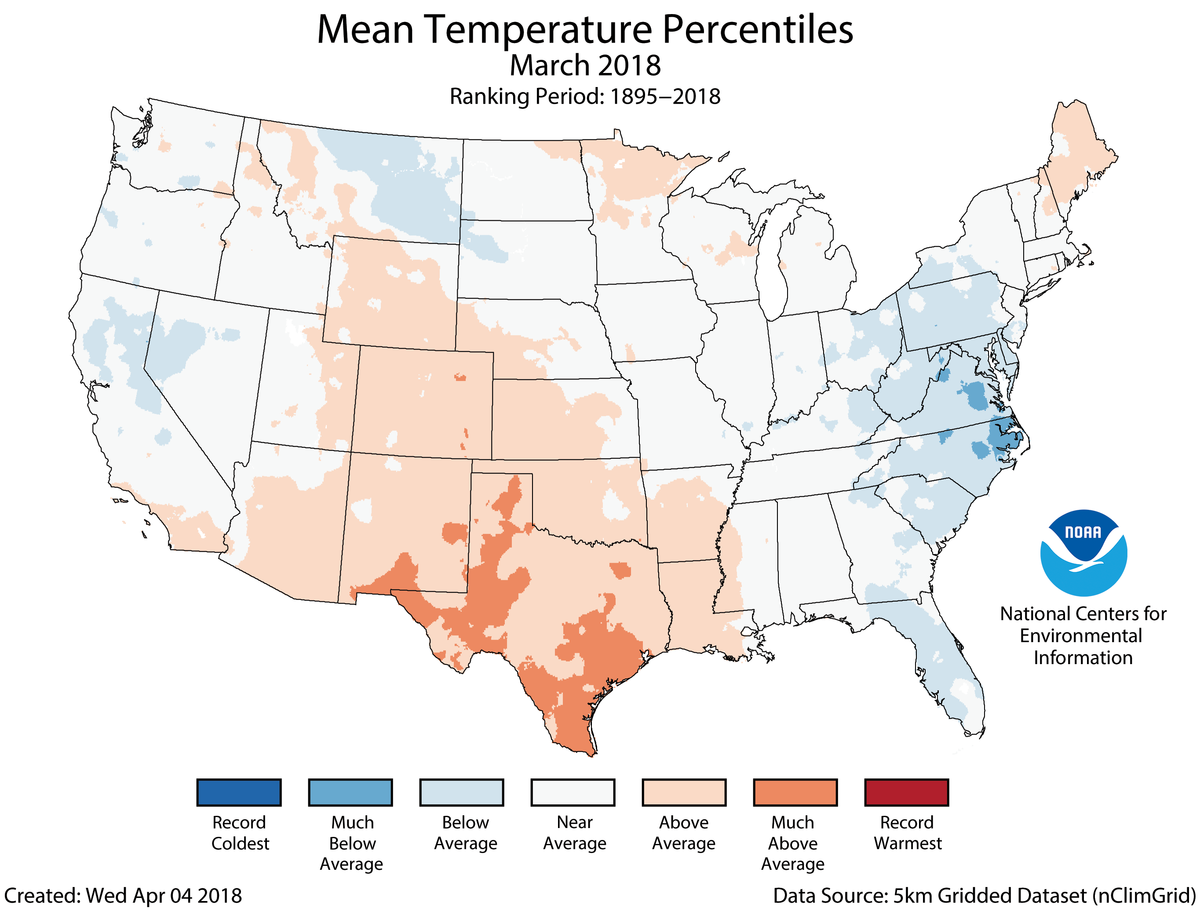
Below-average temperatures were observed along parts of the East Coast, Northern High Plains and West. In the East, the cooler-than-average March was preceded by a record and near-record warm February. Some locations observed March temperatures that were cooler than February, an unusual but not unprecedented occurrence.
-
Above-average temperatures were observed across the south-central U.S., stretching from the Central Rockies through the Southwest and the Southern Plains. Above-average temperatures were also observed in parts of New England and the Upper Midwest.
-
The Alaska March temperature was 17.7°F, 6.9°F above the long-term average. This tied the ninth warmest March in the 94-year period of record for the state. Northern and western Alaska were much warmer than average, with near-average temperatures in southern Alaska. Utqiaġvik (Barrow) had its warmest March on record, while Kotzebue had its second warmest and St. Paul its third warmest.
March Precipitation
-
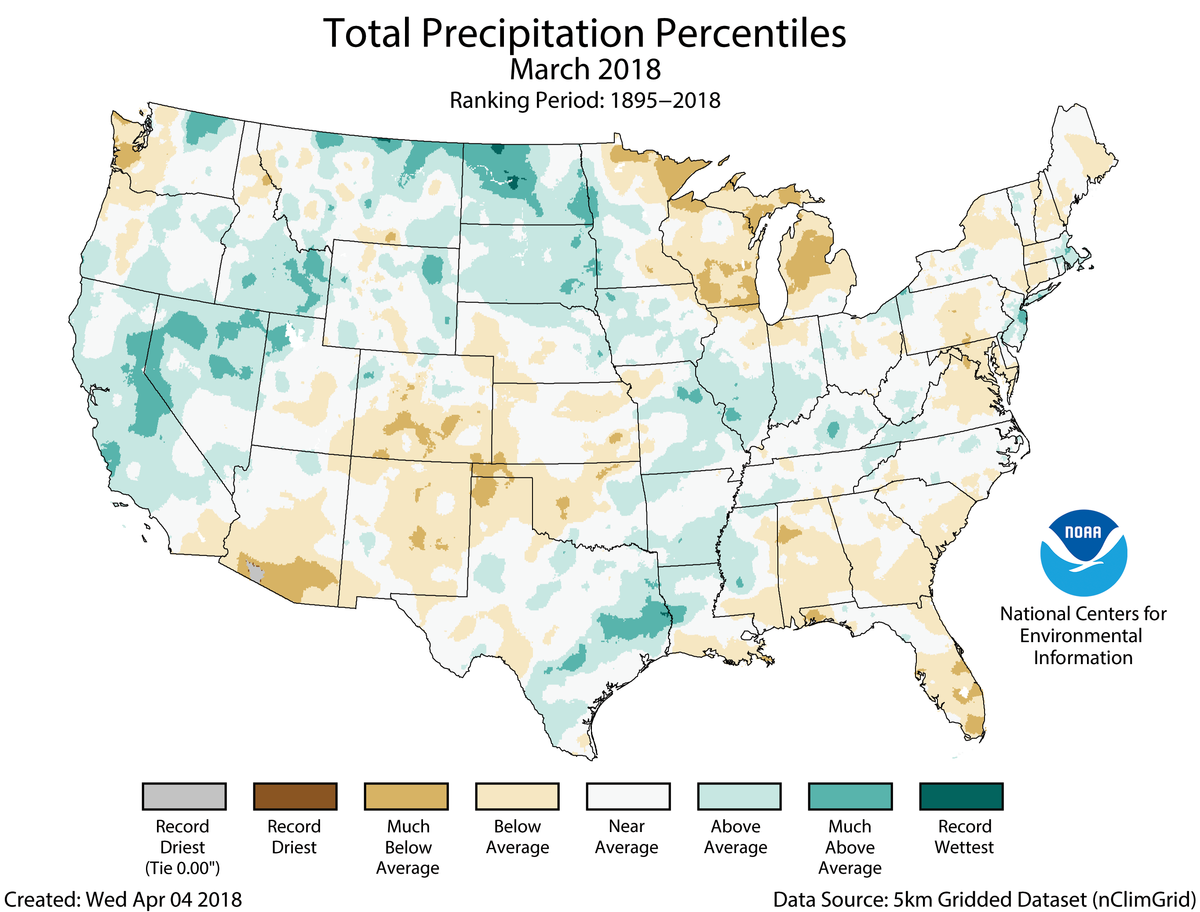
During March, four strong winter storms known as Nor’easters impacted the East, bringing heavy snow across parts of the Midwest and from the Southern Appalachians to New England. Some locations in the East had more snow during March than during the preceding winter months combined. Numerous locations had a top five March snowfall total during 2018, including Boston, Massachusetts; Albany, New York; and Philadelphia, Pennsylvania.
-
Above-average precipitation was observed across parts of the West, Northern Rockies and Plains, Midwest and South. The beneficial precipitation helped to boost snowpack totals in parts of the Sierra Nevada, which were below-average during much of their wet season. However, snowpack totals remained below average in the region.
-
Below-average precipitation was observed across parts of Northwest, Southwest, Great Lakes, Southeast and East Coast. The general lack of precipitation and above-average temperatures in the Southwest contributed to a continuation of very low snowpack in the Southern Rockies and parts of the Great Basin.
-
According to the April 3 U.S. Drought Monitor report, 29.4 percent of the contiguous U.S. was in drought, down from 31.3 percent at the end of February. Drought conditions improved in California, the Northwest, Northern Plains, and parts of the Southern Plains, Mid-Mississippi Valley and interior Southeast. Drought conditions worsened across parts of the Southwest, Central Plains, southern Texas and the coastal Southeast. Drought also developed in the Alaska Panhandle due to several months of below-average precipitation.
Year-to-Date (January–March) Temperature
-
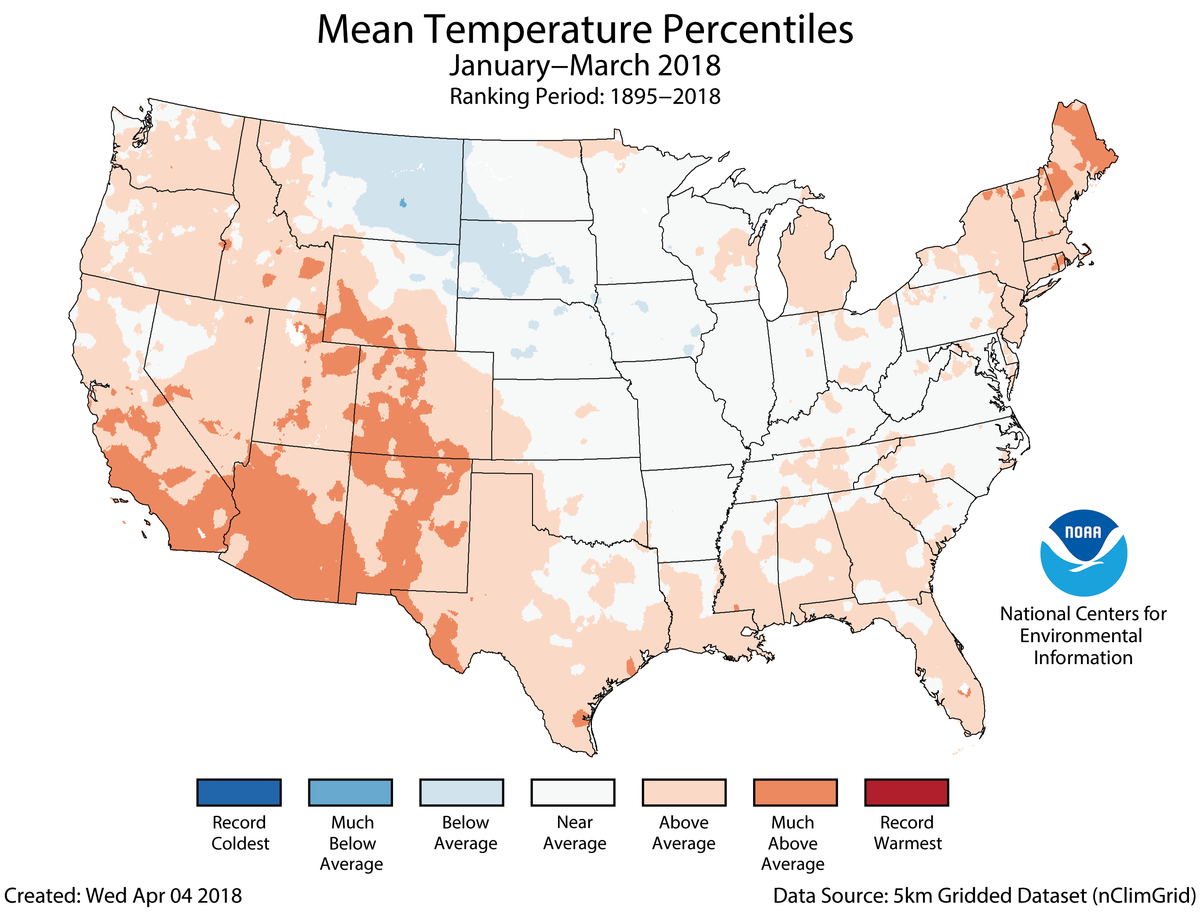
Above-average temperatures were observed across much of the West, South and Northeast. Arizona, Maine and New Mexico each had a January–March temperature that ranked among the 10 warmest on record. Near-average conditions stretched from the Great Plains through the Midwest to Mid-Atlantic with below-average conditions in the Northern High Plains.
-
The Alaska January–March temperature was 12.4°F, 6.5°F above the long-term average, the ninth warmest on record for the state. Record and near-record temperatures were observed across northern and western parts of the state with near-average conditions across southern Alaska and the panhandle. Utqiaġvik (Barrow) had its warmest January–March on record, while St. Paul had its second warmest year to date.
Year-to-Date (January–March) Precipitation
-
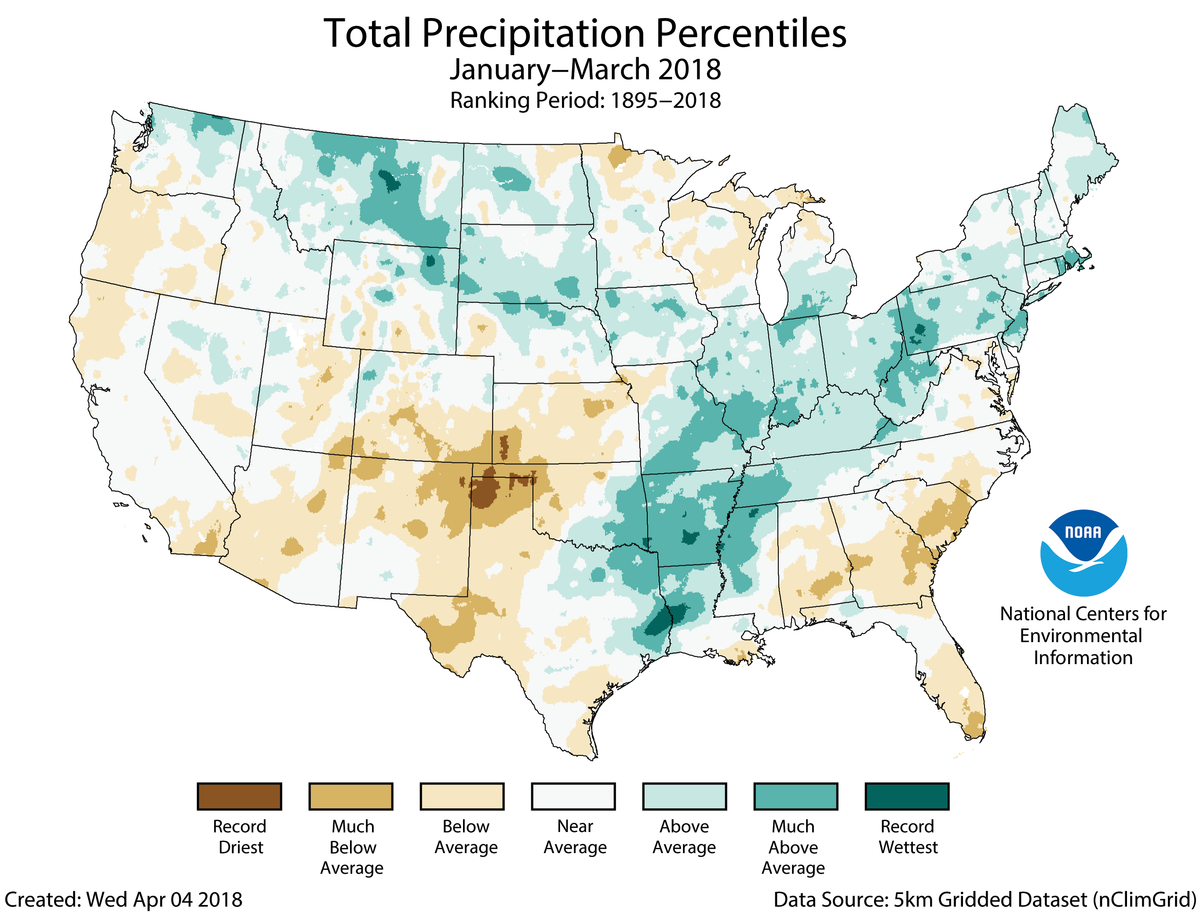
Below-average precipitation was observed in the Southwest, the Southern High Plains, and the Southeast. Parts of the central and southern High Plains of southwest Kansas, northeast New Mexico and parts of the Oklahoma and Texas panhandles observed record dryness for the first three months of the year. Above-average precipitation was observed in the Northern Rockies and Plains, the Mid- to Lower-Mississippi Valley, the Ohio Valley and parts of the Northeast. Arkansas had hits fourth wettest January–March on record with 20.01 inches of precipitation, 7.48 inches above average.
Billion-Dollar Weather and Climate Disasters
-
In April 2018, NCEI added eight weather and climate events from 1981 through 2010 to the Billion-Dollar Weather Disaster list that now surpass $1 billion in inflation-adjusted costs. These events include four severe weather events, two tropical cyclones (Tropical Storm Frances and Hurricane Erin), a freeze and a flooding event. The U.S. has now sustained 230 weather and climate disasters since 1980 where overall damages/costs reached or exceeded $1 billion (based on Consumer Price Index adjustment to 2018). The total cost of these 230 events exceeds $1.5 trillion.

