
Second wettest month on record for the contiguous U.S.

For May, the average contiguous U.S. temperature was 59.5°F, 0.7°F below the 20th century average and ranked in the bottom third of the 125-year record. Despite the cool May, meteorological spring (March–May) had near-average temperatures. The seasonally averaged temperature for the Lower 48 was 50.9°F, 0.1°F below average and ranked in the middle third of the record. The first five months of 2019 were marked by large regional variability in temperature, but when averaged, the contiguous U.S. temperature was 43.4°F, 0.1°F above the 20th century average and also ranked in the middle third of the January–May record.
The May precipitation total for the contiguous U.S. was 4.41 inches, 1.50 inches above average, and ranked second wettest in the 125-year period of record for May as well as second wettest for all months since January 1895. The current record of 4.44 inches occurred in May 2015. Continuing a wet trend, both the spring and year-to-date precipitation totals for the contiguous U.S. were well-above average. The spring precipitation total was 9.85 inches, 1.91 inches above average and the sixth wettest spring on record, while the year-to-date precipitation total was 15.71 inches, 3.32 inches above average and ranked as the wettest year-to-date period for the contiguous U.S. in the 125-year record.
Precipitation across the contiguous U.S. that accumulated over the June 2018–May 2019 12-month period shattered the previous record for any 12-month period with 37.68 inches, 7.73 inches above average. The previous June–May record was 35.47 inches and occurred from June 1982–May 1983. The previous all-time 12-month record was 36.20 inches and occurred from May 2018–April 2019.

This monthly summary from NOAAs National Centers for Environmental Information is part of the suite of climate services NOAA provides to government, business, academia and the public to support informed decision-making.
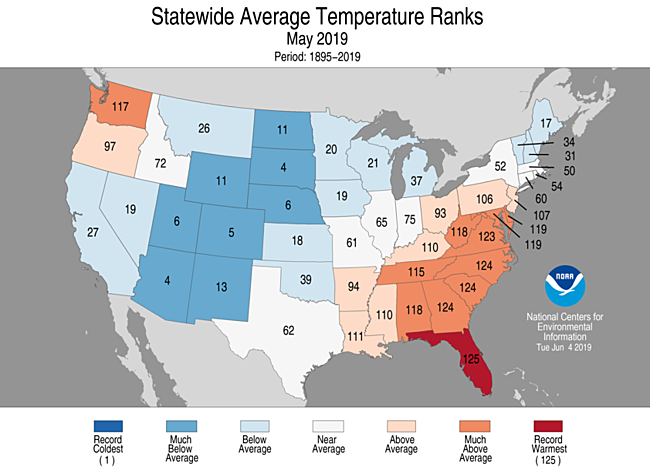
May Temperature

-
Below- to much-below-average temperatures spanned from California, into the Great Lakes and across New England. Five states, from the Southwest to the northern Plains, had a top 10 coldest May on record.
-
Above- to much-above-average May temperatures prevailed from the lower Mississippi River Valley into the mid-Atlantic states as well as across the Pacific Northwest. Florida ranked warmest on record for May with North Carolina, South Carolina and Georgia ranking second warmest.
-
The Alaska average May temperature was 42.9°F, 5.1°F above the long-term mean and the sixth warmest May on record for the state. The Cook Inlet division reported above-average temperatures during May while the remaining divisions ranked much above average for the month.
May Precipitation

-
Near-record to record precipitation was observed from the West Coast through the central Plains and into the Great Lakes and parts of the Northeast, contributing to the second wettest May – and second wettest of any month – on record for the contiguous U.S. Flooding has been an ongoing concern in the central U.S. for several months and was exacerbated in May by frequent and excessive rainfall. Kansas, Nebraska and Missouri ranked wettest May on record while an additional seven states ranked in their top five.
-
Below-average precipitation was observed across the Southeast during May. North Carolina ranked 14th driest on record for the month.
-
Severe flooding along the Arkansas, Missouri and Mississippi rivers occurred during May, and for some locations, including Vicksburg, MS, flooding has been ongoing since mid-February.
-
With records dating back to 1884, Duluth, MN, reported 10.6 inches of snow on the 9th, shattering the city’s May snowstorm record. The previous record was 5.7 inches, which fell May 2–5, 1954.
-
A southward dip in the jet stream over the western contiguous U.S. during May contributed to above-average late-season snowfall. Denver reported its snowiest May in 44 years with 3.9 inches total for the month.
-
According to the June 4 U.S. Drought Monitor report, 5 percent of the contiguous U.S. was in drought, up from 2 percent at the beginning of May.
Other Notable Events
-
Over 500 tornado reports occurred during May – more than double the 3-year average of 226. It was the most active 30-day tornado period since 2011.
-
Subtropical Cyclone Andrea formed on May 20, which is a record fifth consecutive season for a named storm to form in the North Atlantic Basin before the official start of the hurricane season on June 1.
-
According to the U.S. Department of Agriculture and resulting from the excessive spring rainfall, the percentage of corn and soybeans planted by June 2 is the smallest since 1992. Corn and soybean emergence is also the lowest observed since 1998.
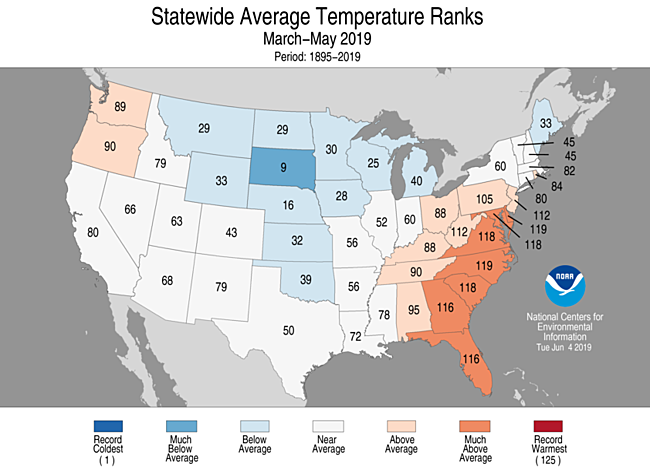
Spring (March–May) Temperature

-
Above- to much-above-average temperatures were observed across the Southeast, Ohio Valley and the mid-Atlantic region as well as across the Northwest. Seven states across the Southeast had one of their 10 warmest March–May periods on record.
-
Below-average temperatures were observed from the northern Rockies to the central Plains and into the Great Lakes and part of New England. South Dakota had its ninth coldest spring on record.
-
The Alaska spring temperature was 32.6°F, 8.6°F above the long-term average, ranking warmest on record for the state. The previous record was 32.0°F set in 2016. The West Coast, North Slope and Interior divisions were all record warmest with much-above-average temperatures occurring across the remaining divisions. Many locations reported their warmest spring on record including: Fairbanks, Northway, McGrath, Utqiaġvik (Barrow) and Kotzebue. Kotzebue exceeded its previous spring temperature record by more than 6°F.
Spring (March–May) Precipitation

-
Above- to much-above-average spring precipitation was observed across most of the contiguous U.S. from California to New England. Kansas had its wettest March–May on record while six additional states had a top five wettest spring.
-
Below-average precipitation during March–May was observed across the Southeast, North Dakota and Washington state, which ranked 13th driest for the spring season.
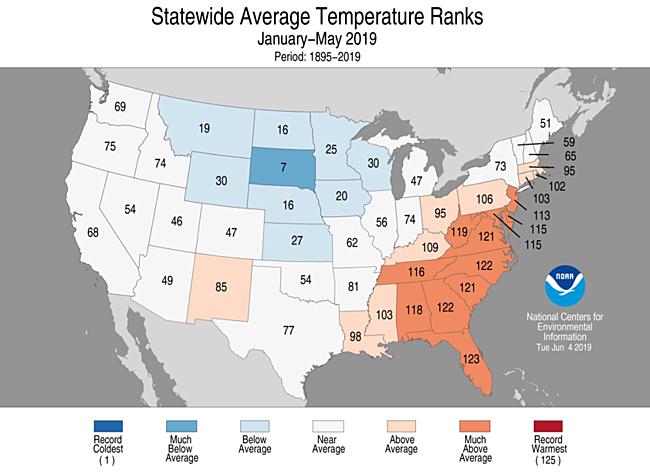
Year-to-date (January–May) Temperature

-
Cooler-than-average temperatures for the year-to-date period occurred across the northern Plains. South Dakota ranked seventh coolest for the January–May period. When averaged for the first five months of the year, much of the Southeast and Ohio Valley were warmer than average. Eleven states had a year-to-date temperature that was much above average.
-
The Alaska year-to-date temperature was 24.1°F, 8.3°F above average, ranking as the second warmest on record. Record warm temperatures were observed across the North Slope and the Aleutians, while above- to much-above-average temperatures were present across the rest of the state. The record low sea ice for parts of the year in the Bering and Chukchi seas likely contributed to the Alaskan warmth.
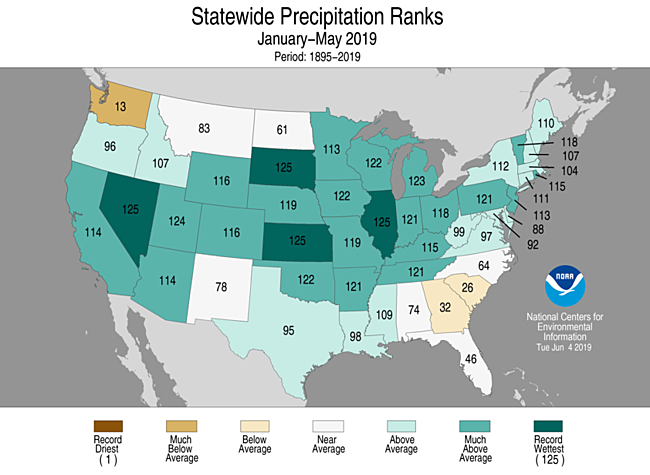
Year-to-date (January–May) Precipitation

- Much-above-average precipitation prevailed across a large portion of the contiguous U.S. during the first five months of 2019. Nevada, South Dakota, Kansas and Illinois ranked wettest for the year-to-date period. Nine additional states had a top 5 wettest start to 2019. Only Georgia, South Carolina and Washington state had January–May precipitation that was below average.


