
This tutorial is designed to guide users of the Weather and Climate Toolkit (WCT) in the process of basic, introductory mapping capabilities. The following sections describe loading data, basic map controls, background controls, overlays, markers, map views and more.
Questions? Please contact our support staff

Loading Data Tutorial
Loading data into the viewer is generally the same no matter what dataset you want to view. Normally when you start up the toolkit, the Data Selector dialog window will be visible. If this did not occur, click on Data in the Left Side Bar or on Data in the menu bar of the viewer then Load Data (CTRL-L also works).

The Data Selector has 8 tabs for different data sources: Find Data, Local, Remote, Single File/URL, THREDDS, NCDC, CLASS, and Favorites.
-
Find Data: Contains a link to an online list of data resources that are supported in the Weather and Climate Toolkit.
-
Local Files: Add data from your local hard drive or local system. The Browse Local button brings up a file selection window to aid you in finding your files.
-
Remote Files: Connect to a remote HTTP or FTP location to view your data files. (Note: Only a directory is needed.)
-
Single File/URL: Connect to a single local file, remove file or OPeNDAP URL. Learn More about OpeNDAP.
-
THREDDS: Connect to the THREDDS data server to view available datasets from Unidata. Learn more about THREDDS data.
-
NCDC Class Order: Enter your HAS order results from a NEXRAD data order. A typical HAS number looks like this: HAS001473242. Remember that data stored on the NCDC FTP site for HAS requests is only available for 7 days after your order is completed.
-
CLASS Order: Enter your CLASS order number from a Satellite data order. A typical CLASS order number looks like this: A1756094. Remember that you only have 120 hours to access the data from CLASS' FTP server once your order is completed.
-
Favorites: A collection of favorites created by the user. Favorites are added by right-clicking on a specific file in the list results and selecting 'Add To Favorites'.
With all of the aforementioned data tabs, except for the 'Single File' option, be sure to click List Files, to bring up a list of your data files. You can sort these files by using the Sort By: drop down selection on the far right. The Filter: text box allows filtering of the files based on simple text matching against all of the list results.

Image of WCT Data Selector Page
Once the files are shown in the list pane, you can either double click on the file you want to view or click on the file you want to view (your selected file should be highlighted) then click Load in the data selection tools button section located below the list of files.

Data Tools Page WCT Buttons for Load, Animate, Export -
There are three buttons, a 'Data Type' chooser and one check box in the data selection tools area: 'Reset Zoom', the 'Data Type' chooser and the 'Load', 'Animate', and 'Export' buttons. The 'Load' button is enabled for selections of only one data file while the 'Animate' and 'Export' buttons are enabled for single or multiple selections. To select multiple files, hold the 'shift' or 'control' key and click on the desired list results.
The data selection tools control these functions:
- Reset Zoom: Resets to the default zoom level for the file type each time you load/reload a file
-
Data Type: Allows manual selection of file type (Grid, Radial, etc...). Generally, the file type is automatically detected from the file naming convention. However, if non-standard file names are used, the manual selection of file type is needed. By default, all '.nc' (NetCDF files with the .nc extension) are considered Gridded data. If a file type cannot be determined from the filename or extension, the Gridded file type will be assigned.
-
Animate: Launches the Animation Generator. For More information on animations - see the Advanced Viewing Tutorial under Animations.
-
Export Data: Launches the Data Export Wizard. For more Information on the Data Export feature see accordion below.
Map Control Tutorial
Basic map controls are a row of control buttons located underneath the menu bar. This tutorial will go over these buttons as well as keyboard and mouse shortcuts.

The buttons illustrated above stand for the following:
- Full Extent: Returns the zoom level to the full extent of the data being viewed.
- Move Left (West): Moves the current view left or geographical west.
- Move Up (North): Moves the current view up or geographical north.
- Move Down (South): Moves the current view down or geographical south.
- Move Right (East): Moves the current view right or geographical east.
- Zoom In: Zooms the current view 1x based on the mouse click point.
- Hand: Moves the current view in both the x and y direction based on a left click and hold of the mouse.
- Zoom Out: Zooms the current view out 1x based on the mouse click point.
- Marker: Allows you to add a marker to the current view. Learn more about markers see the Markers accordion below.
- Identify: Engages the identification mouse tool. Clicking on the map will show the identification dialog and append the value of the active and snapshot layers at the click point. Learn more about identification see Identify accordion below.
- Search: Shows the location and variable search tool. Learn more about the search tool see Search accordion below.
There are several keyboard shortcuts in conjunction to the map control buttons:
- Left Arrow Key: Moves the current view left.
- Right Arrow Key: Moves the current view right.
- Up Arrow Key: Moves the current view up.
- Down Arrow Key: Moves the current view down.
- Page Up Key: Zooms the current view in 1x based on the current view's center point
- Page Down Key: Zooms the current view out 1x based on the current view's center point.
- Home Key: Returns the zoom level to the full extent of the data being viewed.
- Control Left Key: Rotates the current view counter-clockwise. (Note after you pass 90 degrees from the horizontal, background overlays become unavailable, WMS maps still work)
- Control Right Key: Rotates the current view clockwise. (Note after you pass 90 degrees from the horizontal, background overlays become unavailable, WMS maps still work)
A keyboard shortcut menu is also available when you right click your mouse in the viewer menu, the menu functions work when you left click on them. The menu also includes a new tool called the Magnifier.

The Magnifier places a "magnifying glass" in the viewer that magnifies the area inside the circle.
Right clicking on the magnifier will bring up a menu selection close to the magnifier.
Overlay and Background Maps Tutorial
This tutorial will explain how to use the Overlay Selector, which is a tool that controls the layers being displayed, and Data and Overlays.
To open the Overlay Selector, click Layers in the Left Side Tab or click Data in the viewer menu bar, then Layer Selector. CTRL-M will also bring up the Overlay Selector.

The toolkit manages the way information is displayed in the viewer through the use of layers. The Overlay Selector has three tabs: Data layers, Overlay Selector, and Background Maps (WMS).
The Data Layer tab has two sections for different data types available for viewing: radar and gridded/satellite.
Each section has four variables: Visible, Transparency, Smoothing, and Legend which control the following.

Data Layer Sections:
-
Visible: Turns on or off the data layer (Radar or Satellite)
-
Transparency: Sets the transparency of the data layer. This is good for viewing a background map behind a radar or satellite image while still preserving the data. Adjust Values using a drop down percentage list.
-
Smoothing: Sets a smoothing factor (currently only available for radar data) based on a scale from 0 to 50. Be aware that dBZ values are altered to create the smoothed effect, use with caution to preserve information.
-
Legend: A dropdown menu to turn off the legend or choose a different size.
'Active' vs. 'Snapshot' Layers:
In the Weather and Climate Toolkit, a single 'active' data layer may be visualized. However, multiple 'snapshot' layers can be visualized as well, which allows the visual comparison and layering of different data types. To create a snapshot layer, simply click on the 'Snapshot Layer' button on the bottom left.

An entry in the snapshot layer section of the data layer list will be created for each new snapshot layer. Controls are provided to adjust the visibility, transparency and drawing order of the layer. The 'Isolate' button will make the selected snapshot layer the only layer visible, while the 'Zoom To' button will set the current view extent to the extent of the snapshot layer.

The Overlay Selector tab includes different layers which can be added to the background of the viewer to show climate divisions, NEXRAD sites, cities, states, counties, and interstates to name a few.
The layer Visibility is controlled by checking or unchecking the box beside each layer name. The color can be adjusted by clicking on the color button with the layer. The size of the line drawn on the viewer is adjusted by using the dropdown list under size for each layer, size ranges from 1 to 5. Label visibility is controlled by checking or unchecking the label box with each layer.

At the bottom of the overlay selector tab, the Data Layer On Top checkbox defines whether the radar data should be drawn on top of the overlays (this is turned off by default). The Load Shapefile button brings up a file selection window to add your own ESRI Shapefiles to the overlay selector.
Background Maps - Web Map Services (WMS):
Background Maps (WMS) is the third tab in the Overlay Selector. Background Maps (Web Map Services) or WMS for short is a feature that gathers unique maps from the internet and places them in the viewer based upon the location the viewer is zoomed to and the zoom level. Maps include: ESRI Street Maps, NASA Blue Marble, ESRI Global Map, various USGS maps, and more.
The WMS feature requires a live connection to the internet.
There are three background map selections in the WMS tab: Background 1, 2 and 3. These 3 background layers allow different maps to be layered to form a single background image.

'Background 1' will be drawn first, while 'Background 3' will be drawn last. For example, USGS Shaded Relief could be selected as Background 1, with ESRI Roads as Background 2 and Watersheds (HUCs) as Background 3, shown in the image below.
To toggle the currently selected WMS map to black/white check or uncheck the B/W checkbox.
The Auto-Refresh checkbox (checked by default) allows the WMS service to download the most current map when the viewer has been moved or zoomed. Refresh is the manual way of accomplishing the same task.
In the Overlays section, you can hide all overlays by clicking the Hide; to show the default overlays again click Default.

Markers
Markers allow you to create annotated markers on the viewer map. Markers are automatically saved and will persist throughout closing and re-opening the Toolkit. Adding markers is very easy using the marker tool located in the Map Controls toolbar. For more information on Map Controls, visit Map Controls above.
Once you have selected the Marker Tool, you can add a marker by clicking on the area of interest on the viewer. Once you have clicked and created a marker, the Marker Editor will pop up.
The Marker Editor controls what labels are displayed and the addition and deletion of markers. You can also bring up the Marker Editor at any time by clicking View in the viewer menu bar, then clicking Marker Editor

In the top third of the Marker Editor, is the DMS/Deci button which switches the coordinates of the marker between Degrees, Minutes, Seconds and Decimal Degrees. Beside the coordinates of the marker are the Datum options, which change the geographic coordinate system used for the marker. By default, WGS84 is used. NAD27 and NAD83 are also available. For more information on Geographic Coordinates and Datums, please refer to: NOAA's National Geodetic Survey
Labels are filled with the following information by default (listed below), but can be edited. Unchecking the 'Auto-Fill' checkbox will disable this functionality.
NEXRAD (Weather Radar Data)
- Label 1: Lat/Lon information for the marker
- Label 2: Range/Azimuth information for the marker
- Label 3: Height information if applicable
All other data types (Gridded and GOES Satellite Data)
- Label 1: Lat/Lon information with data value
- Label 2: Grid index information (column, row)
- Label 3:[Empty]
A list of current markers is below these controls. Multiple markers can be selected by holding down Control or Shift on the keyboard then clicking the markers in the list.

The following options are available:
-
Visible: This checkbox toggles the visibility on or off for selected markers.
-
Auto-Fill Labels: A checkbox that turns on or off the auto fill labels feature.
-
Add: Adds the created marker to the viewer.
-
Remove: Removes the currently selected marker from the viewer.
-
Remove All: Removes all created markers.
-
Import: Import markers from a Comma Separated Text (CSV) file. The format is identical to the format used when exporting markers to CSV. An example of the format:
label1,label2,label3,longitude,latitude
test label1,test label2,test label3,-81.4942,36.3278
test label1,test label2,test label3,-81.4942,36.4278
test label1,test label2,test label3,-81.4942,36.5278
test label1,test label2,test label3,-81.4942,36.6278
test label1,test label2,test label3,-81.4942,36.7278
test label1,test label2,test label3,-81.4942,36.8278
- Export: Export Markers as a Comma Separated Text (CSV), Shapefile, or Well Known Text file.
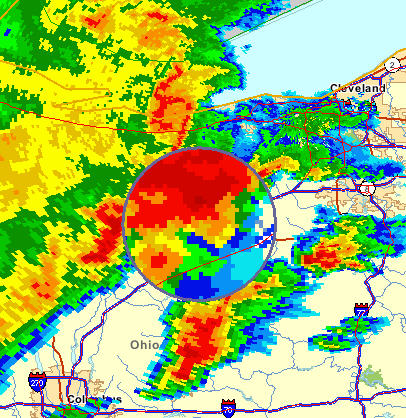
An example of a marker being used to pinpoint a 65 dBz location within a hook echo of a tornado.

Identify
The identify tool is located in the Map Controls toolbar. For more information on Map Controls, visit Map Controls Above.
Once you have selected the Identify Tool, you can query the values of the active data layer or any snapshot layer by clicking on the map. Layers that are not visible will be ignored.

The Identification Results window shows the latitude, longitude, and values of the selected locations. In addition to clicking on the map, preloaded locations may be used to generate identification results. In the 'Identify From Existing Locations' section, any loaded marker (generated using the Marker Editor), or Overlay may be used. The 'Matches' text box allows filtering of the locations based on a simple text match. The Copy button will copy the results to the system clipboard, while the Save button allows the results to be saved to a text file.
Search
The search tool is located in the Map Controls toolbar. For more information on Map Controls see the section above.

Once you have displayed the Search Tool, you can perform searches and add markers using the Google Geocoding Service as well as launch online searches of metadata for currently loaded active data layers.
The Search Dialog includes a 'Location Search' section and 'Data Information Web Search' section.
Location Search
The Google Geocoder is used to determine the latitude and longitude coordinates for input locations. The search criteria are very flexible, and can accept entries such as addresses, cities, zip codes, airport codes and landmarks. Entering a [lat],[lon] combination (such as '35.0,-90.0'), will execute a reverse geocoding operation. This will find a matching address, city, state, country or landmark closest to the provided coordinate. Following a successful search operation, a marker is automatically generated showing the results.
Data Information Web Search
Metadata decoded from the current active data layer is automatically populated into the search fields. The 'Search' button will launch the default browser and navigate to the selected search site and execute a search with the selected field. Several types of metadata can be selected, including the Variable Name, File Format, Data Description and more. The current search engines supported are Google, Yahoo and the NASA Global Change Master Directory (GCMD).
Image Capture | Export
This tutorial explains how to use the three single image capture buttons (Save Image, Save KMZ, Copy Image) in the right sidebar. For information on how to use the Capture button located on the right sidebar as well, review the Animation Tutorial.
Save Image
The Save Image button opens up a save dialogue to save the current view in one of the following formats: JPEG, GIF, PICT, TIFF, BMP, TARGA, and PNG.

Save KMZ
The Save KMZ button saves the current view in Google Earth's (and others) KMZ format. <(((Visit The Google Earth Tutorial))) add new link> to learn how to create KMZ's.
Copy Image
The Copy Image button copies the current view to your clipboard. Once on your clipboard you can paste into a word processing program or any other program that accepts image pasting from the clipboard.

Data Services
Data services are Internet dependent datasets, such as the NIDIS Drought Monitor, which provide streamlined, user-friendly access to weather and climate data.
The following sections will showcase the various data services available via the Toolkit.
Drought Monitor
The U.S. Drought Monitor is a product produced by the National Integrated Drought Information System (NIDIS) Program Office located at the National Oceanic and Atmospheric Administration's Earth Systems Research Laboratory in Boulder, Colorado.
More information regarding the Drought Monitor may be obtained by going to the National Integrated Drought Information System.
Viewing Drought Monitor data in the toolkit is very easy. With the viewer open, click on the Services tab located on the Left Side Bar, and then click Drought Monitor.
Alternatively you can click on the Data tab from the drop down menu, and then hover over Data Services then click Drought Monitor.
Once you have done this the U.S. Drought Monitor Browser will popup.

The Drought Monitor browser will be your way to navigate through the dataset. The Select Date scroll window will allow you to select the dates available for viewing. Once you have selected a date (you can only select one date to view in the viewer, multiple date selection will be explained later) click Display in the lower left of the browser.
You can control the transparency between the background map and the Drought Monitor data by using the Transparency drop down percentage menu. Next to that you can control the background maps by clicking the Background Maps button. For more information on background maps, see accordion above.

You can animate images by selecting multiple dates; you can do this by holding down 'Select' or 'Control' then clicking in the select date scroll window the dates you like to animate, then press Animate. A new animation window will appear. For more information on animations, see the Advanced Viewer Tutorial.
When multiple dates are selected for animation, you have the option to change the order in which they are animated by using the Order drop down menu to the right of the Animate button.
To clear the data being displayed on the viewer, click Clear.
If you would like to view the raw data, you can do so by clicking the Raw Data (KML/SHP/Excel) button beside the clear button. This will open up a web browser to the University of Nebraska-Lincoln Drought Monitor Data Archive.
Clicking on the About button will bring up a pop up window with information about the Drought Monitor.