The National Ocean Service (NOS) Estuarine Bathymetric Digital Elevation Models are gridded bathymetry datasets interpolated from 150 years’ worth of hydrographic survey data collected by the former NOS Special Projects Office. The initiative produced datasets for 70 estuaries in the conterminous United States with sufficient data coverage to support detailed bathymetric processing.
Specifications and File Structure
Estuarine bathymetric data are available as gridded products with 30 meter spatial resolution. The extent shapefile, visualization files, and density images are packaged together, while the DEM is available as a stand-alone download.
Note: Do not use bathymetric data for navigation. Refer to NOAA nautical charts, and NOS source data to navigate in U.S. coastal waters.
Contact
Use Cases
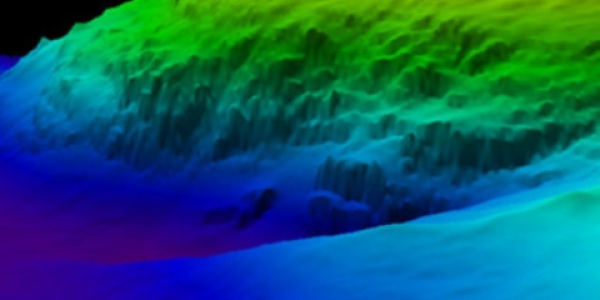
Bathymetric data adds another dimension to geographic mapping and modeling, and can be used as either a background layer or 3D surface for draping thematic maps such as benthic or marine organism habitats and geologic data. It also delineates the lower boundary of the water column in hydrodynamic models used to monitor and predict the movement of oil and hazardous materials, temperature and salinity distributions, animal migration patterns, and model storm surge and tsunami effects.
Data Characteristics
The perimeter of each bathymetry aligns with estuarine drainage area water boundaries determined by the NOS Coastal Assessment Framework. Elevations do not extend beyond the high water line. Bathymetric depths are vertically referenced to the local tidal datum, typically Mean Lowest Low Water (MLLW) averaged over a 19 year tidal epoch. There are no plans to produce bathymetries for other estuaries, but some existing bathymetries are updated as part of Coastal Digital Elevation Models, which can accessed through the Bathymetric Data Viewer application.
Frequently Asked Questions
- What is the source data for the bathymetry?
- Consult the metadata for each estuary to view source data.
- How do you view data in GIS applications?
- NetCDF data can be opened in a variety of GIS software packages, including ESRI ArcGIS. Alternatively, users can convert from netCDF to other common raster formats using Geospatial Data Abstraction Library utilities to facilitate use in a GIS environment.
- Why do sections of some estuaries appear ramped or have a constant slope?
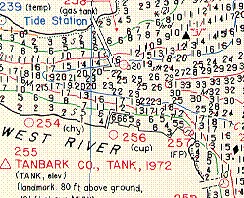
- The constant slope may be real or an artifact of sampling density. Very few estuaries have a constant sounding density over the entire area of the estuary. Some estuaries have larger gaps in data than others, and the density of the original soundings often change from one section of the estuary to another. A triangulation process is used to produce the gridded data. Areas with dense concentrations of soundings will produce more accurate grid values than areas where the soundings are sparse. Some areas have gaps of many hundreds of meters. These areas will show interpolation across large distances which will appear evenly spaced. In order to determine where these areas are, the user can download the Sounding Coverage Images, which are included in the supplemental information zipfile for each DEM. These images allow the user to get a general idea of the distance between the original soundings data so that they may assess for themselves whether or not the original point coverages meet their project's resolution needs.

 encompasses the U.S. Eastern Seaboard, Gulf of Mexico, Puerto Rico/U.S. Virgin Islands, and Hawaii.")