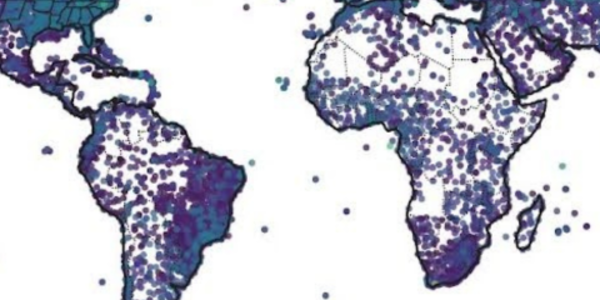
The NOAA Merged Land Ocean Global Surface Temperature Analysis (NOAAGlobalTemp, formerly known as MLOST) combines long-term sea surface (water) temperature (SST) and land surface (air) temperature datasets to create a complete, accurate depiction of global temperature trends. The dataset is used to support climate monitoring activities such as the Monthly Global Climate Assessment, and also provides input data for a number of climate models.
Methodology
To achieve global temperature coverage, NOAAGlobalTemp combines the sea surface temperature (SST) with land surface air temperature (LSAT). Data is available as a series of temperature anomalies relative to a 1971–2000 monthly climatology. To compute anomalies relative to climatologies for other time periods (e.g. 1991–2020), calculate the average of the NOAAGlobalTemp anomalies for that time period (e.g. 1991–2020), and then subtract the average from the original anomalies.
Current Version: 6.0.0
Version 6.0.0 differs from 5.1 in that an Artificial Neural Network method to improve the surface temperature reconstruction over the land is implemented.
Data
Gridded
Global Gridded 5° Monthly data are available in netCDF format and can be downloaded from an HTTPS data folder or THREDDS Server:
- NCEI Data Portal
- THREDDS (update pending)
Time Series
Monthly and annual land–ocean temperature time series as well as land-only and ocean-only time series are available from 1850 to present for several zonal bands.
Climate at a Glance
This interactive tool provides global charts and graphics using NOAAGlobalTemp data.
Input Datasets
Paper Citations
- Huang, B., M.J. Menne, T. Boyer, E. Freeman, B.E. Gleason, J.H. Lawrimore, C. Liu, J.J. Rennie, C. Schreck, F. Sun, R.S. Vose, C.N. Williams, X. Yin, H.-M. Zhang, 2020: Uncertainty estimates for sea surface temperature and land surface air temperature in NOAAGlobalTemp version 5. , J. Climate, 33, 1351-1379, DOI: 10.1175/JCLI-D-19-0395.1.
- Zhang, H.-M, J.H. Lawrimore, B. Huang, M.J. Menne, X. Yin, A. Sȧnchez-Lugo, B.E. Gleason, R.S. Vose, D. Arndt, J.J. Rennie, and C.N. Williams, 2019: Updated Temperature Data Give a Sharper View of Climate Trends. Eos, 100, https://doi.org/10.1029/2019EO128229.
- Vose, R.S., B. Huang, X. Yin., D. Arndt, D.R. Easterling, J.H. Lawrimore, M.J. Menne, A. Sanchez-Lugo, H.-M. Zhang, 2021: Implementing full spatial coverage in NOAA’s global temperature analysis. Geophysical Research Letters, 48, e2020GL090873. https://doi.org/10.1029/2020GL090873
- Huang, B., X. Yin, M. J. Menne, R. Vose, and H. Zhang, 2022: Improvements to the Land Surface Air Temperature Reconstruction in NOAAGlobalTemp: An Artificial Neural Network Approach. Artif. Intell. Earth Syst., 1, e220032, https://doi.org/10.1175/AIES-D-22-0032.1.
Data Citation
Huang, B., X. Yin, M. J. Menne, R. Vose, and H. Zhang, NOAA Global Surface Temperature Dataset (NOAAGlobalTemp), Version 6.0.0 [indicate subset used]. NOAA National Centers for Environmental Information. https://doi.org/10.25921/rzxg-p717
Older Versions
Methodology
To achieve global temperature coverage, NOAAGlobalTemp combines the sea surface temperature (SST) with land surface air temperature (LSAT). Data is available as a series of temperature anomalies relative to a 1971–2000 monthly climatology. To compute anomalies relative to climatologies for other time periods (e.g. 1991–2020), calculate the average of the NOAAGlobalTemp anomalies for that time period (e.g. 1991–2020), and then subtract the average from the original anomalies.
5.1
Updates
Version 5.1 differs from 5.0 in two major ways;
- 5.1 has complete coverage of all land and ocean areas for the entire period of record
Data
Gridded
Global Gridded 5° Monthly data are available in netCDF format and can be downloaded from one of the two links:
Time Series
Monthly and annual land–ocean temperature time series as well as land-only and ocean-only time series are available from 1850 to present for several zonal bands.
Climate at a Glance
This interactive tool provides global charts and graphics using NOAAGlobalTemp data.
Input Datasets
Data Citation
Vose, R.S., B. Huang, X. Yin., D. Arndt, D.R. Easterling, J.H. Lawrimore, M.J. Menne, A. Sanchez-Lugo, H.-M. Zhang, NOAA Global Surface Temperature Dataset (NOAAGlobalTemp), Version 5.1 [indicate subset used]. NOAA National Centers for Environmental Information. doi: 10.25921/2tj4-0e21.
Updates
Version 5 incorporates upgraded versions of ERSST and GHCN-M for increased land and ocean spatial coverage, and improved treatment of historical changes in observing practice.
Data
Gridded
Monthly data are available in netCDF format and can be downloaded from one of the two links:
- Global Gridded 5° Data on NCEI data portal
- Global Gridded 5° Data on NCEI THREDDS server
Time Series
Monthly and annual land–ocean temperature time series as well as land-only and ocean-only time series are available from 1880 to present for several zonal bands.
Climate at a Glance
This interactive tool provides global charts and graphics using NOAAGlobalTemp data.
Input Datasets
- ERSST v5
- GHCN-M v4
Paper Citations
- Huang, B., M. J. Menne, T. Boyer, E. Freeman, B. E. Gleason, J. H. Lawrimore, C. Liu, J. J. Rennie, C. Schreck, F. Sun, R. Vose, C. N. Williams, X. Yin, H.-M. Zhang, 2020: Uncertainty estimates for sea surface temperature and land surface air temperature in NOAAGlobalTemp version 5. J. Climate, J. Climate, 33, 1351-1379, DOI: 10.1175/JCLI-D-19-0395.1.
- Zhang, H.-M., J. H. Lawrimore, B. Huang, M. J. Menne, X. Yin, A. Sanchez-Lugo, B. E. Gleason, R. Vose, D. Arndt, J. J. Rennie, and C. N. Williams, 2019: Updated temperature data give a sharper view of climate trends. EOS, 100, https://doi.org/10.1029/2019EO128229.
Data Citation
Zhang, H.-M., B. Huang, J. Lawrimore, M. Menne, Thomas M. Smith, NOAA Global Surface Temperature Dataset (NOAAGlobalTemp), Version 5 [indicate subset used]. NOAA National Centers for Environmental Information. doi:10.25921/9qth-2p70 [access date].
Input Datasets
- ERSST v4
- GHCN-M v3.3.0
Global Gridded 5° Data ASCII Time Series
Data Citation
Zhang, H.-M., B. Huang, J. Lawrimore, M. Menne, Thomas M. Smith, NOAA Global Surface Temperature Dataset (NOAAGlobalTemp), Version 4.0 [indicate subset used]. NOAA National Centers for Environmental Information. doi:10.7289/V5FN144H [access date].
Contact Info
- Boyin Huang: boyin.huang@noaa.gov
- Russell Vose: russell.vose@noaa.gov
- Xungang Yin: xungang.yin@noaa.gov
- Huai-Min Zhang: huai-min.zhang@noaa.gov
Specifications
Data Sources
Extended Reconstructed Sea Surface Temperature (ERSST), Global Historical Climatology Network monthly (GHCNm), International Comprehensive Ocean-Atmosphere Data Set (ICOADS), International Arctic Buoy Programme (IABP)
Spatial Coverage
Global 5° × 5°
Time Frame
1850–Present


