Accuracy
Earth’s magnetic field can be difficult to predict because of changes to the fluid flow in the planet’s outer core. The large inertia of the magnetic field system means that these changes take place over many years. By collecting magnetic field data from surveys over several years, we can create accurate models of the current magnetic field and predict how it will change through linear extrapolation. This means that, with sufficient satellite magnetic observations, the WMM is very accurate on its release date. However, the model coefficient values are updated every five years because they become less accurate over time.
Limitations
The WMM and the charts produced from this model only describe the long-wavelength portion of Earth's internal magnetic field, which is primarily generated in Earth's fluid outer core. The effects of the Earth's crust and upper mantle, ionosphere, and magnetosphere are not represented in the WMM. This means that a magnetic sensor such as a compass or magnetometer may observe spatial and temporal magnetic anomalies when referenced to the WMM. Some local, regional, and temporal magnetic declination anomalies can exceed 10 degrees. Anomalies of this magnitude are not common but they do exist. Declination anomalies of the order of 3 or 4 degrees are not uncommon but are usually of small spatial extent. See the Enhanced Magnetic Model (EMM) or the High Definition Geomagnetic Model (HDGM) for a model that includes crustal fields down to 50 km wavelength.
Lower Limits
The WMM's error limits are defined at the World Geodetic System 1984 (WGS84) ellipsoid surface worldwide. However, the WGS84 surface can be above or below ground/sea level at any given location. To address potential error sources from underground (local magnetized rock) and close to the ocean floor (basaltic rocks), the WMM has a practical lower limit set at ground level, and at 1km below the ocean surface. See Table 2 for a complete list of maximum usable heights.
Upper Limits
The WMM is valid far into space, but its exact upper limit can vary because of the way solar wind affects the magnetic field in space. Solar wind intensity is constantly changing, which in turn changes the WMM’s valid height. The WMM’s current valid height can be directly charted against the current Kp index value or the NOAA Space Weather Prediction Center (SWPC) Geomagnetic Storms Scale, which are both provided in Table 1:
| Scale | Description | Physical measure | Average Frequency (1 cycle = 11 years) |
|---|---|---|---|
| G 5 | Extreme | Kp = 9 | 4 events per cycle (4 days per cycle, ~0.1%) |
| G 4 | Severe | Kp = 8, including a 9- | 100 events per cycle (60 days per cycle, ~2%) |
| G 3 | Strong | Kp = 7 | 200 events per cycle (130 days per cycle, ~4%) |
| G 2 | Moderate | Kp = 6 | 600 events per cycle (360 days per cycle, ~9%) |
| G 1 | Minor | Kp = 5 | 1,700 events per cycle (900 days per cycle, ~22%) |
| G 0 | Normal | Kp = 0,1,2,3,4 |
The WMM is valid to the heights shown in Table 2 corresponding to the current real-time Kp index G scale value. The WMM is valid from the ground up to the elevation indicated in the table. Over the ocean, the WMM is expected to meet the MilSpec error limits outlined in section 3.4 of this document down to 1 km below the surface of the ocean. Geomagnetic G5 conditions are extremely rare (4 days per solar cycle, ~0.1% of the time), and the associated altitude limits are expected to be much lower than for G4 conditions, but these levels couldn’t be reliably estimated. The WMM should not be used during a G5 event.
| Component (Milspec Err) | G0 altitudes (km) | G1 altitudes (km) | G2 altitudes (km) | G3 altitudes (km) | G4 altitudes (km) | G5 altitudes (km) |
|---|---|---|---|---|---|---|
| GV (N) (1°) | 0 to 5,000* | 0 to 5,000* | 20 to 3,800 | Exceeds | Exceeds | Exceeds |
| GV (S) (1°) | 0 to 4,000* | 0 to 4,000* | 0 to 3,800 | 0 to 2,200 | 0 to 300 | Not recommended |
| Decl. (1°) | 0 to 6,000* | 0 to 6,000* | 0 to 6,000* | 0 to 6,000* | 0 to 6,000* | Not recommended |
| Incl. (1°) | 0 to 10,000* | 0 to 9,500 | 0 to 7,800 | 0 to 7,700 | 0 to 7,300 | Not recommended |
| F (280 nT) | 0 to 3,400 | 0 to 2,500 | 0 to 1,900 | 0 to 1,900 | 0 to 1,900 | Not recommended |
| H (200 nT) | 0 to 3,100 | 0 to 1,900 | 0 to 1,200 | 0 to 1,100 | 0 to 800 | Not recommended |
| X (140 nT) | 0 to 2,100 | 0 to 1,000 | 0 to 300 | 10 to 200 | Exceeds | Exceeds |
| Y (140 nT) | 0 to 2,100 | 0 to 2,000 | 0 to 1,800 | 0 to 1,600 | 20 to 1,100 | Not recommended |
| Z (200 nT) | 0 to 1,900 | 0 to 1,500 | 0 to 1,200 | 0 to 1,200 | 0 to 1,200 | Not recommended |
Based on the WMM military specification, “Blackout Zones” (BoZ) are areas around the north and south magnetic poles where compasses are not accurate and should not be relied on for navigation. The BoZ are defined as regions around the north and south magnetic poles where the horizontal intensity of Earth’s magnetic field (H) is less than 2000 nT. In BoZs, WMM declination values are not accurate and compasses are unreliable.
We also define a “Caution Zone” (2000 nT <= H < 6000 nT) around the perimeter of the BoZs where compasses should be used with caution because they may not be fully accurate. The blackout (unreliable) and caution zones are displayed in figures 1 and 2. The WMM online/offline software displays warnings when the user location is within these zones.


The WMM2025 software and online calculator include an error model that providesing uncertainty estimates for every geomagnetic element (X, Y, Z, H, F, I and D) and every location at Earth's surface. This model is built on the results of the error analysis (see the WMM2025 technical report, to be published in Spring 2025), but also takes he geometrical relationships between the various components into account. It includes both the commission error (due to inaccuracies in model coefficients) and the omission error (due to missing contributions to the total geomagnetic field such as crustal and external fields). The error values (Table 1) may be interpreted as one standard deviation difference between a hypothetical measurement and the calculator result for a location.
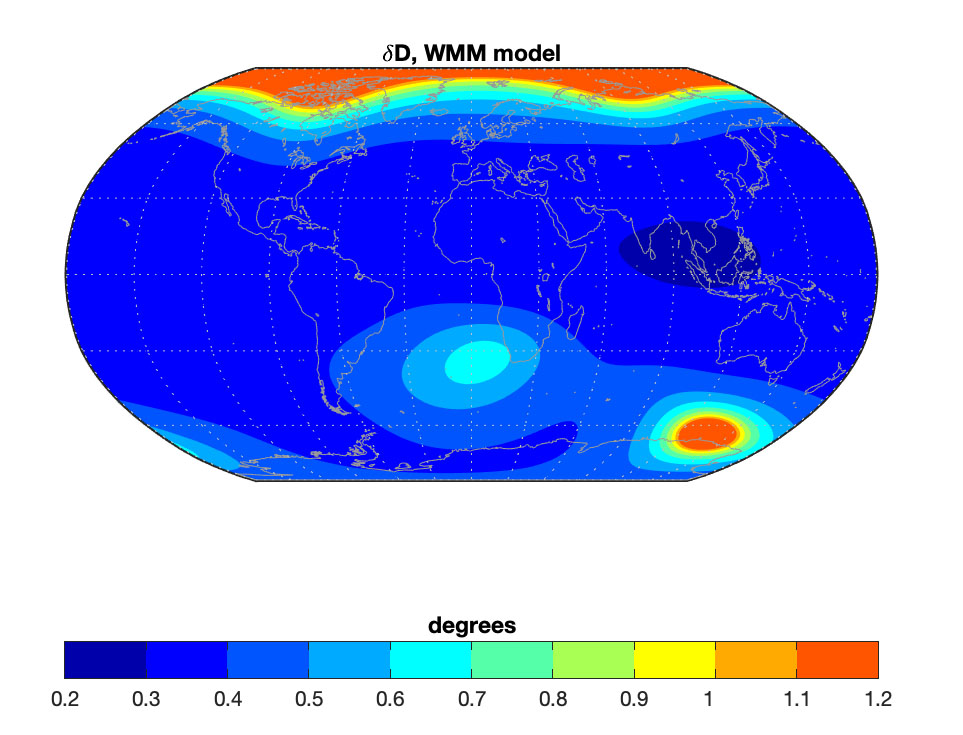
Figure 3 provides a global map of the magnetic declination error. This map illustrates that the error is lower at mid- to low-latitudes, and larger near the magnetic poles and an area close to South Africa where the horizontal field is very low.
| Component | Uncertainty |
|---|---|
| X | 137 nT |
| Y | 89 nT |
| Z | 141 nT |
| H | 133 nT |
| F | 138 nT |
| I | 0.20° |
| D | √(0.262+(5417/H)2 )° |