
Align your eclipse viewing plans with our climatological averages

In just a few days time the annular solar eclipse is set to cross parts of the contiguous United States during the spookiest month of the year. Goblins, ghouls, and witches aside, watching the sun display this spine-tingling phenomena will certainly enhance your October experience. Watch as the sun temporarily casts a ringlike shadow as the annular eclipse path crosses from Oregon through Texas.
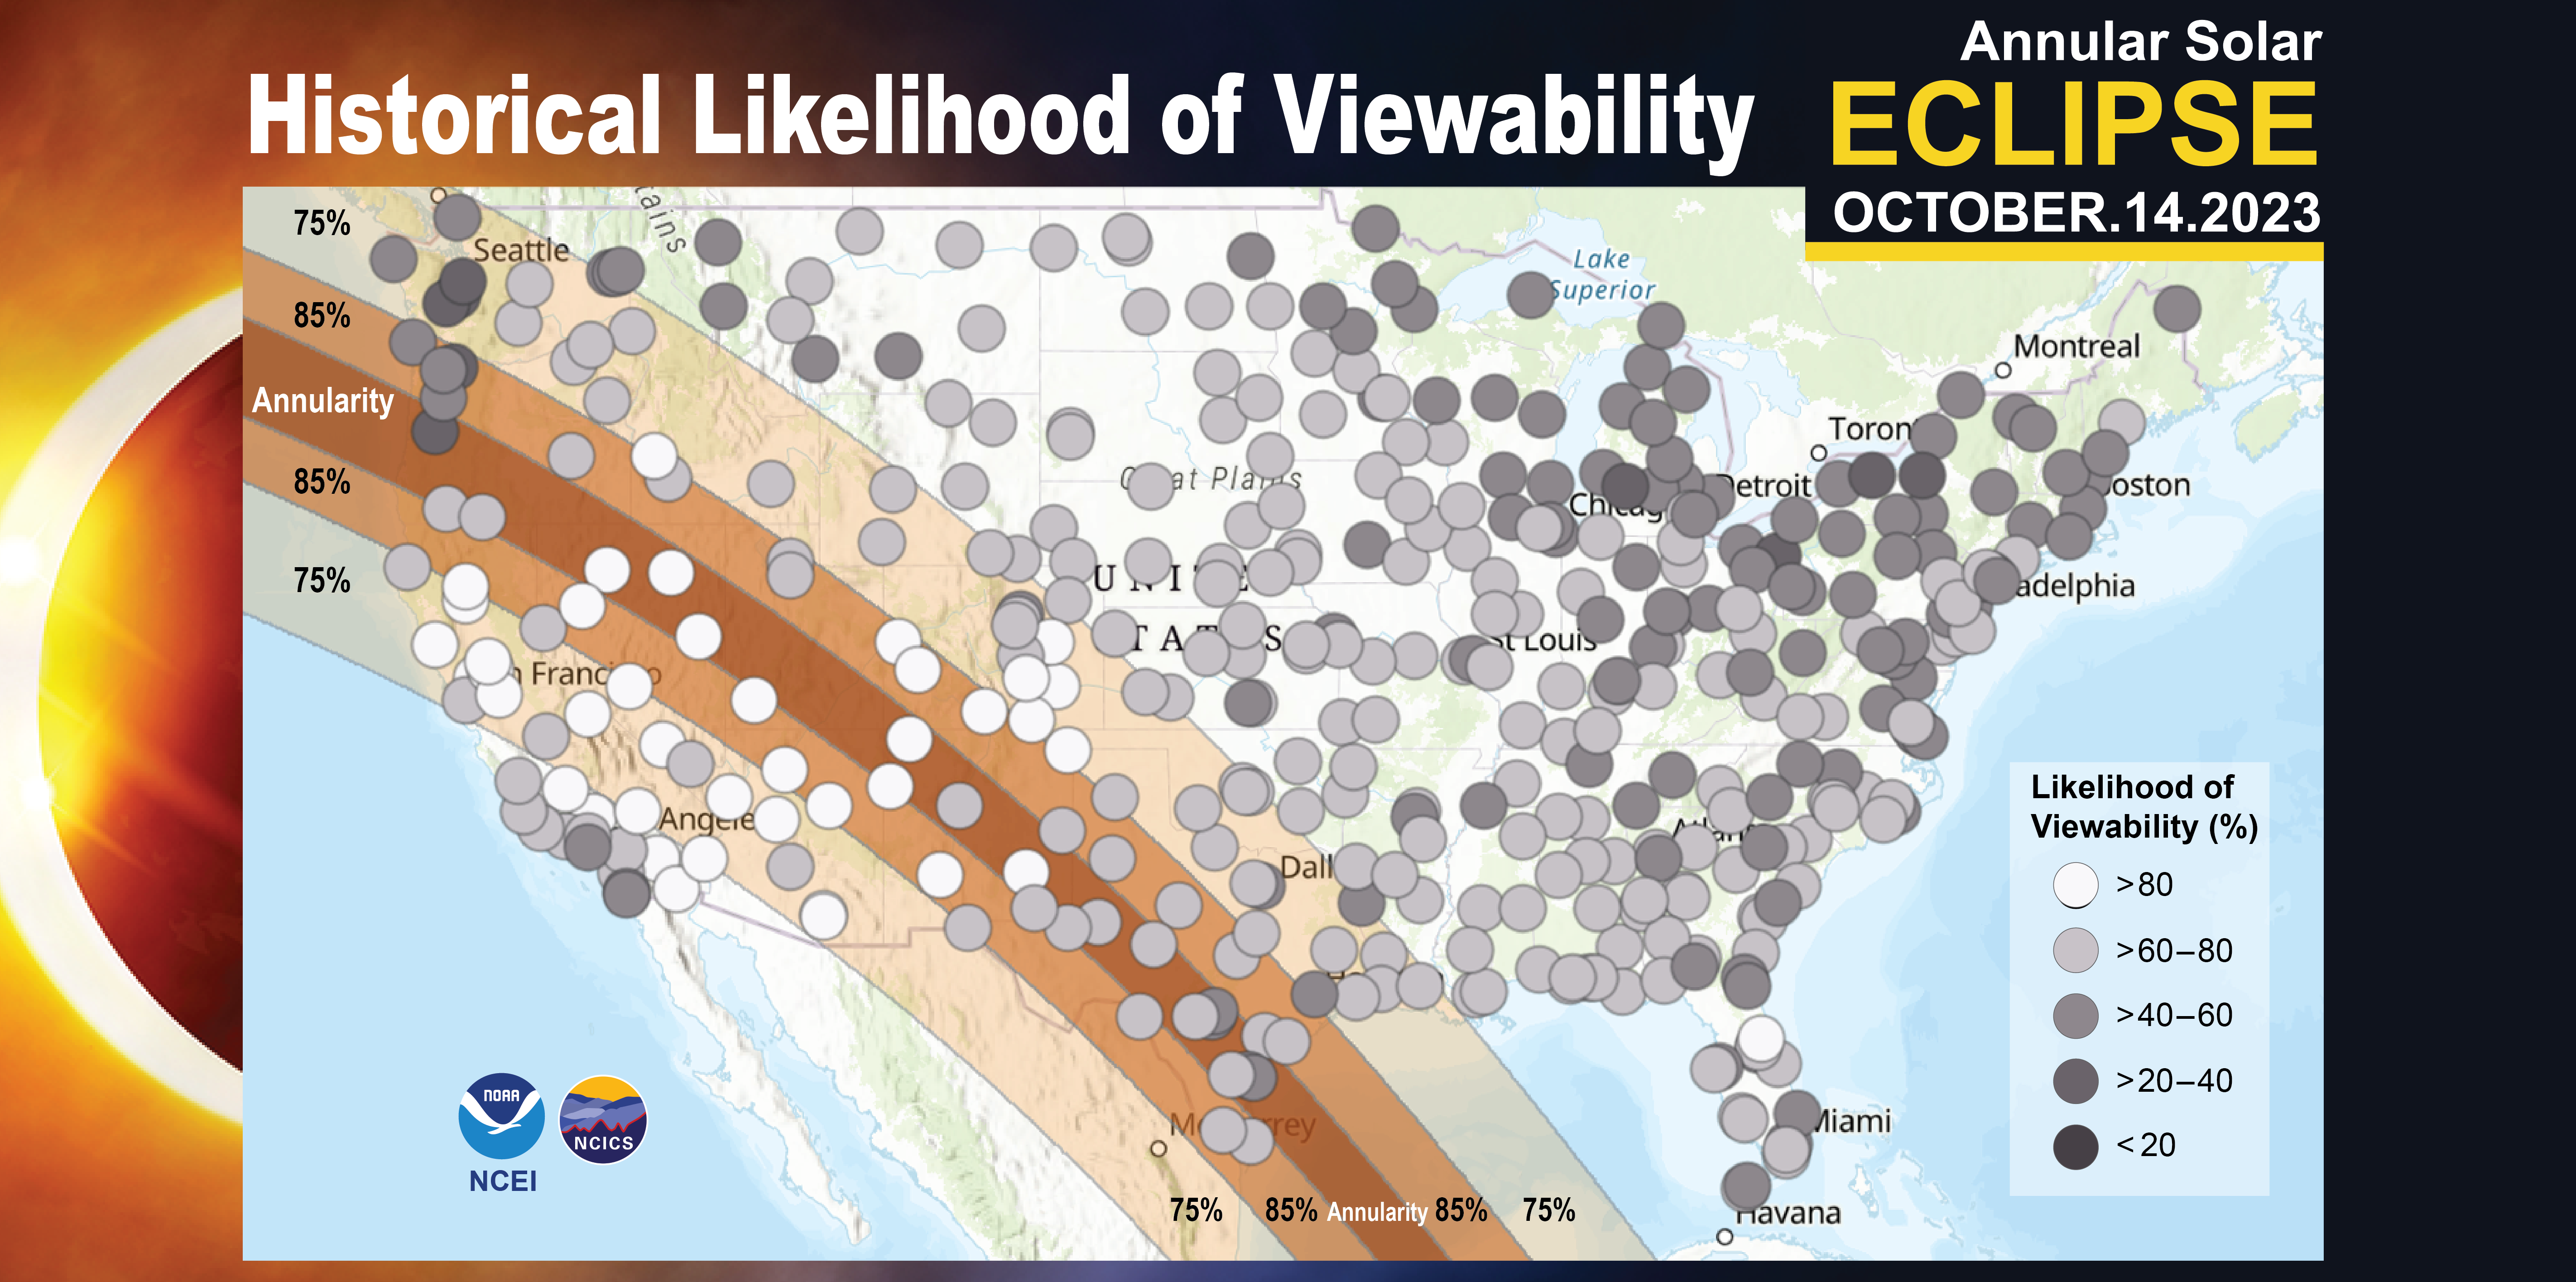
While weather can be eerily unpredictable, the U.S. Climate Normals-based interactive map can steer us in the right direction—to an unobstructed path of annularity, that is.
NOAA’s National Centers for Environmental Information (NCEI) couldn’t have prepared for this event on our own. We’re proud to have worked with the North Carolina Institute for Climate Studies (NCICS) to review past cloud conditions for the October 14, 2023 annular eclipse to create an interactive map! The interactive map shows the average heat index, temperature, wind chill, and viewability across the contiguous U.S.—-these values may be useful for finding the best spot in your region for viewing the annular eclipse. A cloud situated right over the sun would certainly dampen the mood and we’re betting on our “Historical Likelihood of Viewability'' map and the local weather forecast from NOAA’s National Weather Service (NWS) to help you find the best spot.
Our Most Popular Tool
There’s no doubt that the U.S. Climate Normals are often highlighted in our web stories due to their diverse range of data products and uses. The U.S. Climate Normals include all-too important hourly information on typical cloud cover, temperature, humidity, heat index, and hourly wind chill conditions. The most recent U.S. Climate Normals cover conventional 30-year (1991–2020) and supplemental 15-year (2006–2020) time periods in the Data Access Tool.
First produced in the 1950s, the U.S. Climate Normals products provide information about the historical climate conditions of thousands of locations across the United States. Once a decade, NCEI generates the official U.S. Climate Normals to meet our user community needs. These requirements are also fulfilled at the request of the World Meteorological Organization (WMO) and NWS.
The U.S. Climate Normals are intended to be ideal for anyone’s climate needs—a farmer planning for the first fall freeze or a traveler planning their wardrobe based upon the average temperature in that area. For NCEI, the U.S. Climate Normals were invaluable for creating an interactive map that helps determine where may be the best viewing location for the October 14, 2023 annular eclipse.
Where Did NCEI Eclipse Data Come From?
Knowing the direct path of annularity is pivotal for viewing the solar eclipse. But thanks to our pals at NASA, they know how much we rely on their all-too important data and they didn’t leave us waiting.
Although NASA is known for their larger exploits, like creating giant spacecrafts that propel people to the moon, NASA’s 2023 Annular Solar Eclipse site also provided us with several pivotal pieces of information: the timing and duration of the solar eclipse and the paths of annularity and obscuration levels (i.e., the percent of the sun obscured by the moon).
From there, data were extracted from each of NCEI’s hourly climate stations and combined with NCEI's climate information—all of which was used to determine the weather conditions and typical cloudiness during the annular eclipse at each climate station.
Coverage You Can Count On
In case you’re interested in expanding your eclipse viewing into a morning full of festivities, join NESDIS at the Sun, Moon, and You viewing event in Albuquerque, New Mexico. This event is a collaborative effort with NOAA, NASA, and National Science Foundation to provide attendees with an amazing viewing experience, along with dozens of information booths and experts from all over the country to enhance the annular solar eclipse. Based on our interactive map, historically, there’s only a 7.8% chance of overcast conditions in Albuquerque during the eclipse.
Still starry-eyed for NCEI stories? See our NCEI total solar eclipse story in early 2024—we’ll provide maps and information about the average climate conditions before the moon crosses between the Earth and the Sun.


