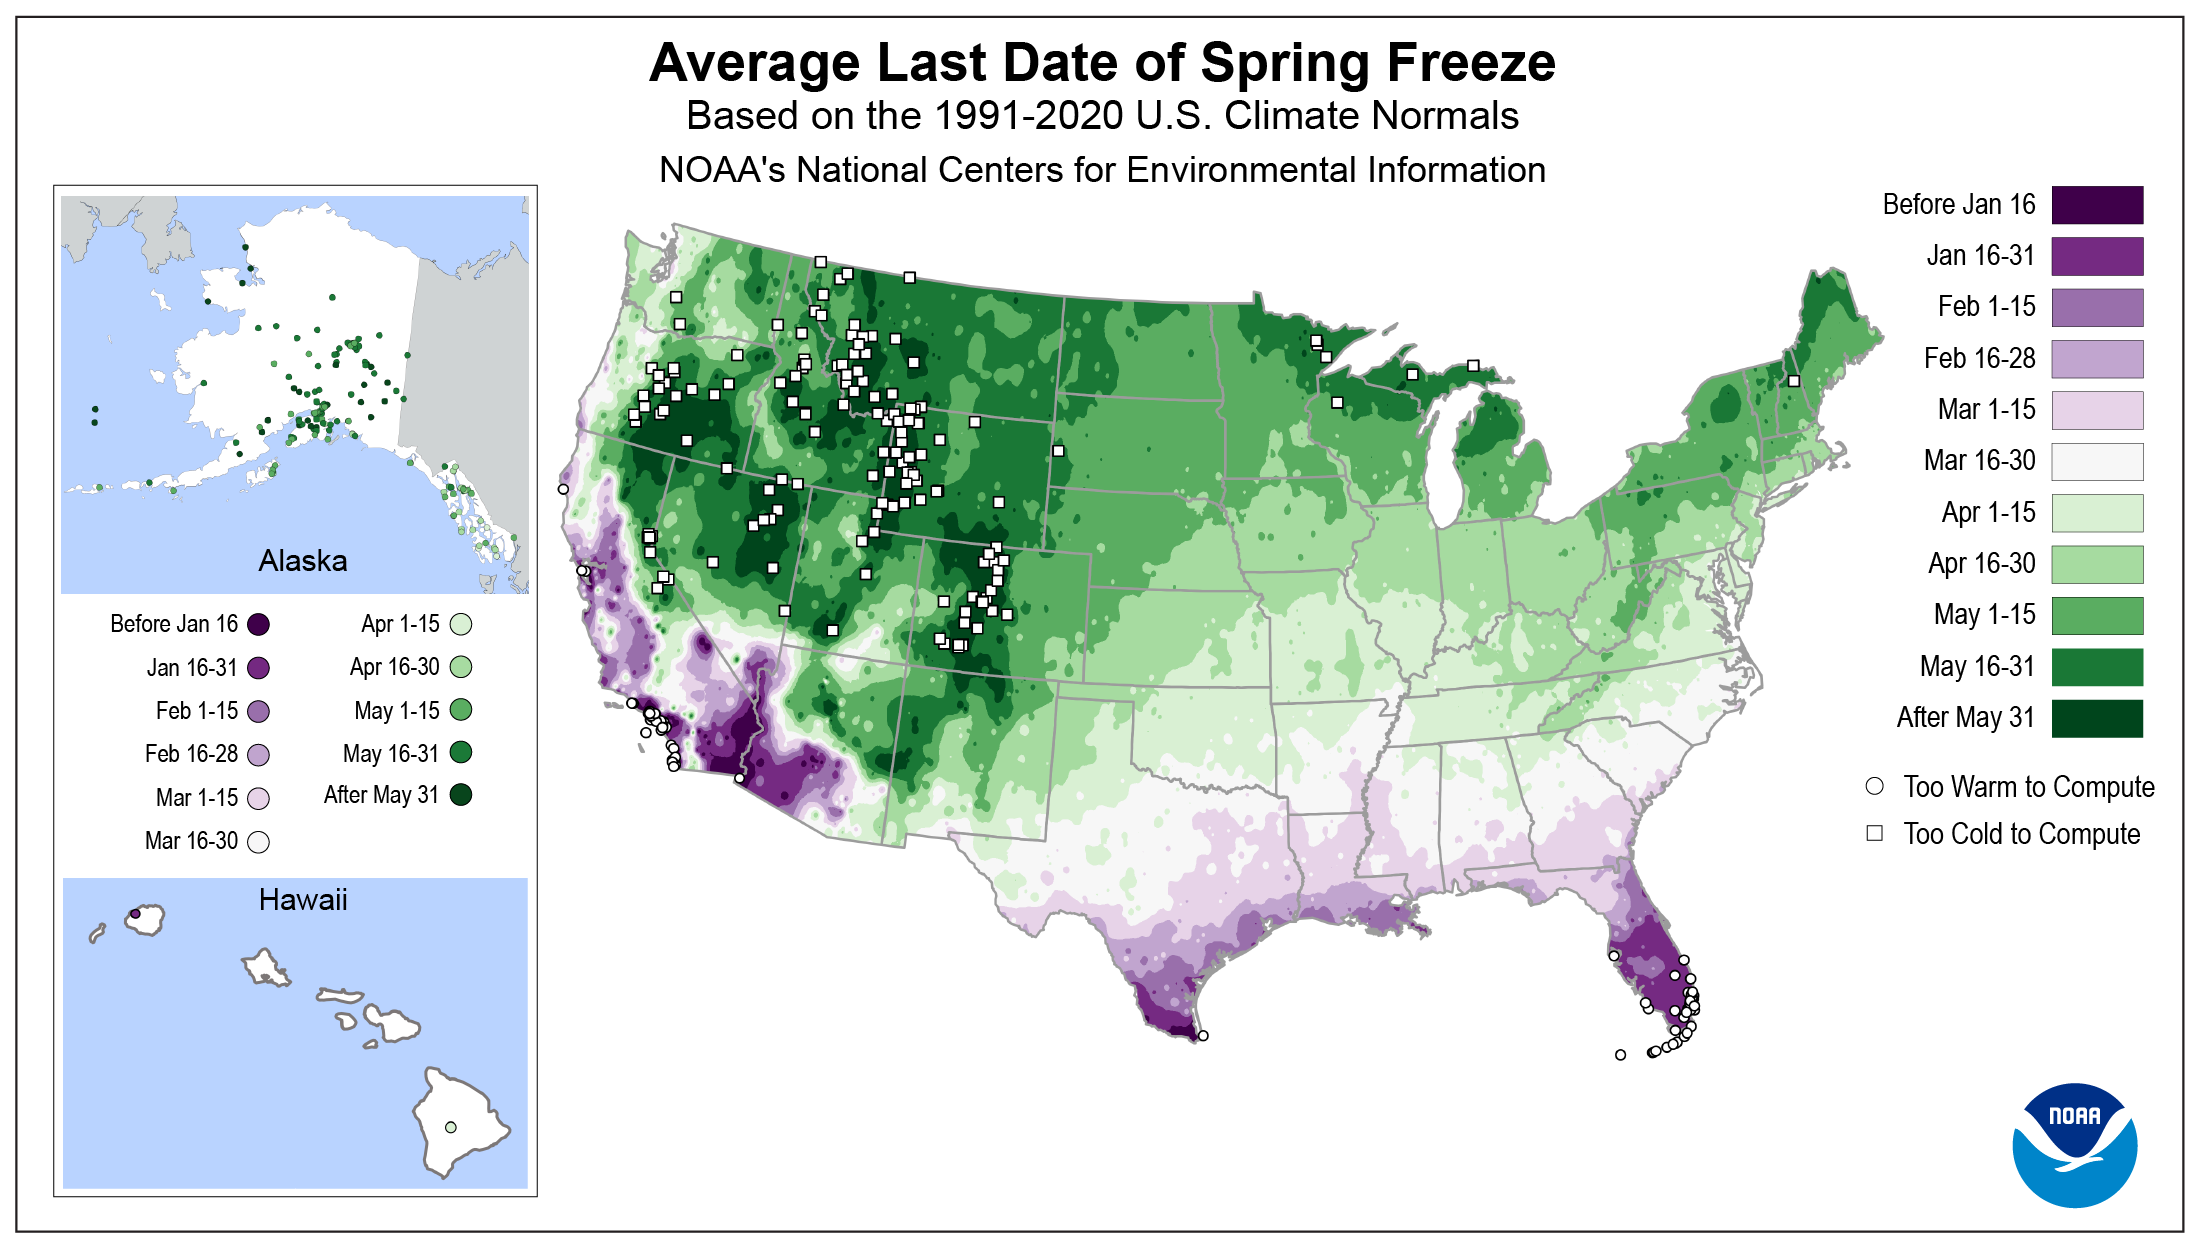
Know when the last of the freezing weather leaves your area

Tired of the wintry temperatures? Well, you don’t need a crystal ball to determine when the last frost may cover your newly potted plants. Instead, take a look at our Average Last Date of Spring Freeze map. Values were derived from the 1991–2020 U.S. Climate Normals—a database of 30-year averages of climatological variables, including temperatures.

This map of the United States shows the most common date range you can expect to see temperatures dip to 32°F or below for the last time. The map also reveals some interesting regional differences across the country. In the Northeast and Southeast, the last spring freeze date generally progresses through time moving northward on the map. For example, south Florida likely saw their last spring freeze before January 16. The West region of the U.S. is a different story—the changes are much more complex due to elevation and coastal influences. For additional information and an interactive map with more details on your region, visit Climate.gov.
Where is Puerto Rico?
Wondering where Puerto Rico is on the map? The limited observation network and unique climatology in this region poses distinct issues in calculating the average date of the last spring freeze. Puerto Rico falls into the “too warm to compute” category, meaning that they very rarely, if ever, see freezing temperatures.
In Alaska, many stations have cold summers that put them in the "too cold to compute" category—which prevents a more reliable mapping of the last spring frost. However, spots on the map have been depicted using average conditions to help Alaskans gauge when to put away their parkas.
Average (Ag) Normals
Ag Normals for 1991–2020 have been produced by NCEI. These updates include the chances of freezing temperatures on any given day and other cold thresholds, which are important for certain crops or pests. The normal length of the growing season and your first freeze date in the fall are also available, along with the expected growing degree days at any climate station. Ag Normals can help farmers determine when they’re most likely to see their last spring freeze, allowing mitigation of some risks to crop vulnerability. Additionally, the Ag Normals can help determine where pests are likely to overwinter, such as inside buildings, under loose bark, fallen leaves, etc. Plant nurseries can use these Normals to help determine where and when to advertise plants and seeds to customers in a specific area.
While this map shows the average timeframe of the last spring freeze across the United States, each calendar year’s actual conditions may widely vary based on weather patterns. To see how your weather forecast matches up with the Climate Normals, visit Weather.gov.


