
The United States had its second warmest February and sixth warmest winter on record

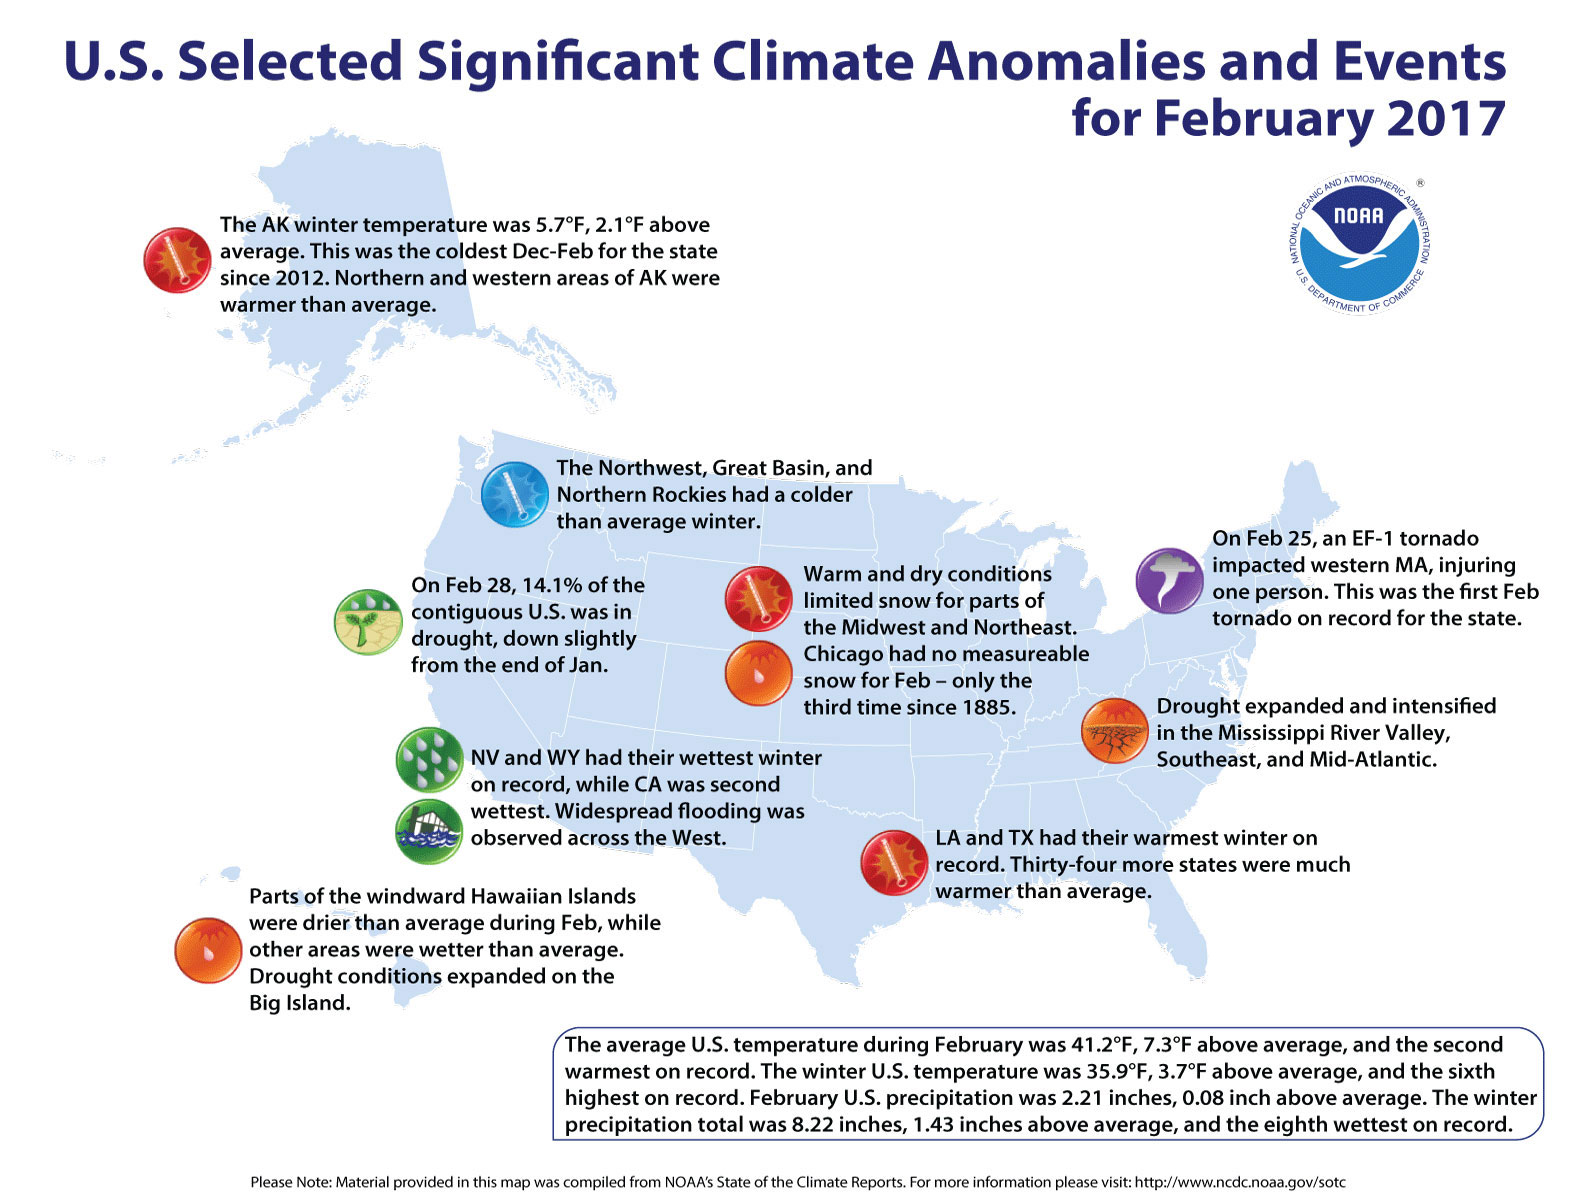
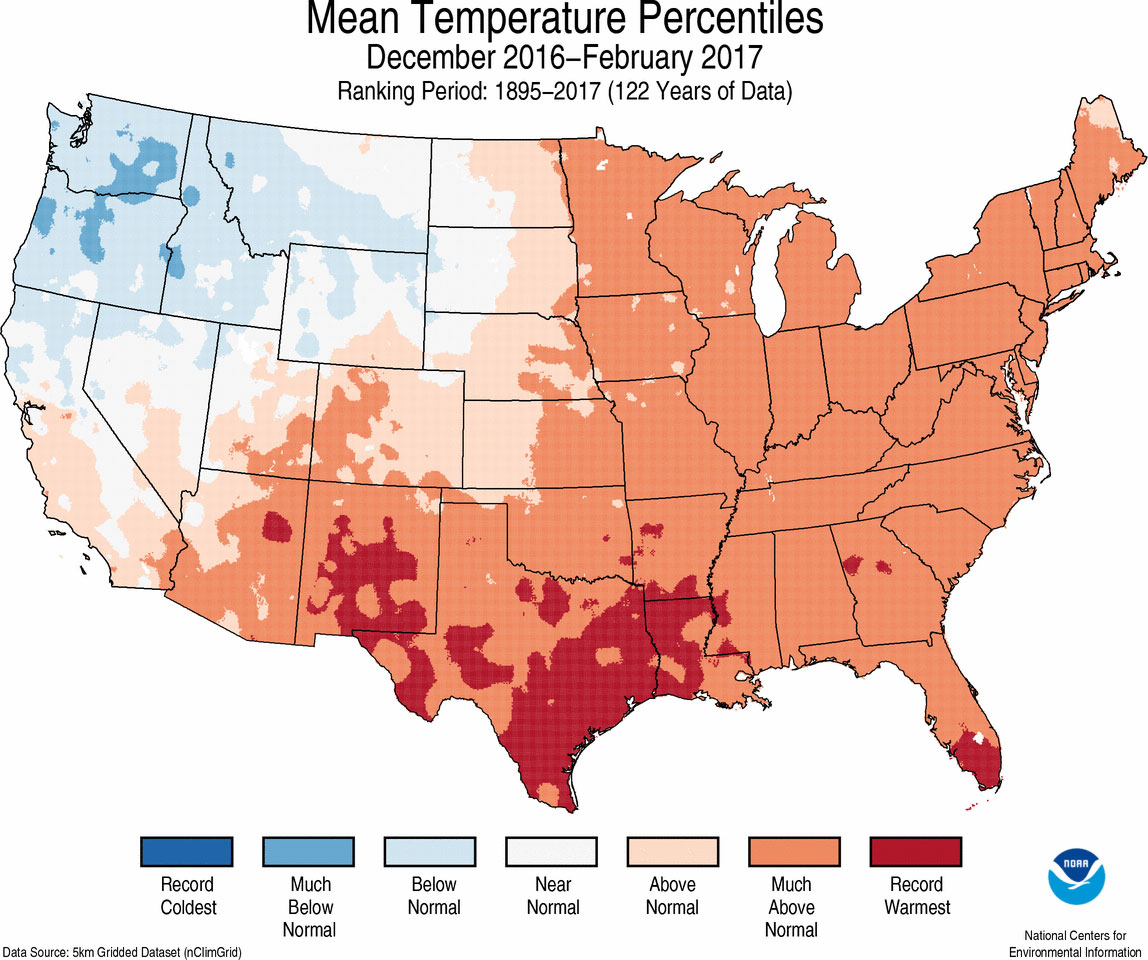
During February, the average contiguous U.S. temperature was 41.2°F, 7.3°F above the 20th century average. This ranked as the second warmest February in the 123-year period of record. Nearly one-quarter of the U.S. was record warm in February. Only February 1954 was warmer for the nation at 41.4°F. Between December 2016 and February 2017, the average temperature across the contiguous U.S. was 35.9°F, 3.7°F above average, the sixth warmest winter on record.
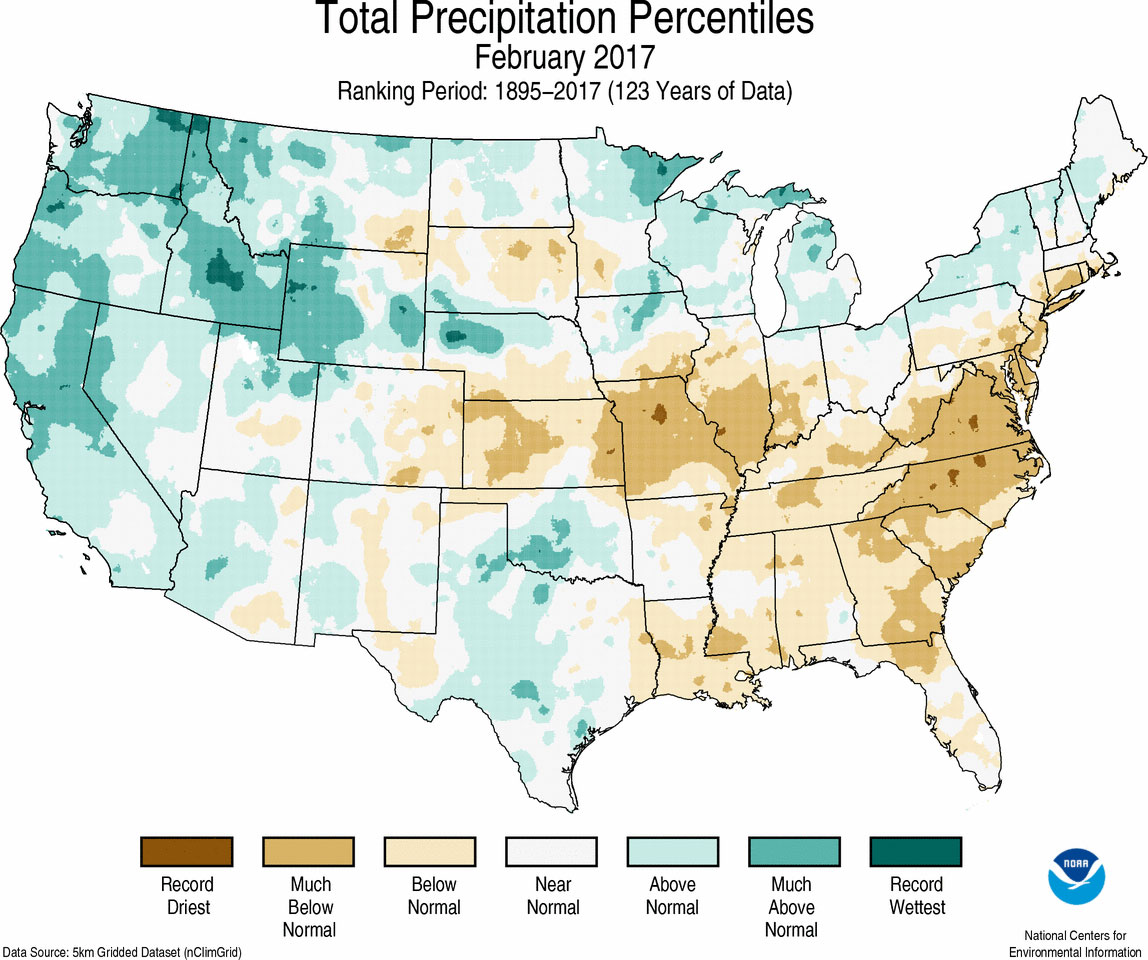
The February precipitation total was 2.21 inches, 0.08 inch above the 20th century average, and ranked near the median value in the 123-year period of record. Above-average precipitation across the West offset below-average precipitation in the Midwest and along the East Coast. The winter precipitation total was 8.22 inches, 1.43 inches above average, the eighth wettest on record. This was the wettest winter since 1998 for the Lower 48.
See all February and winter (December 2016 to February 2017) U.S. temperature and precipitation maps.
This monthly summary is part of the suite of climate services NOAA provides to government, business, academia and the public to support informed decision-making.
Access a larger version of the U.S. selected significant climate anomalies and events for February 2017 map.
February Temperature
-
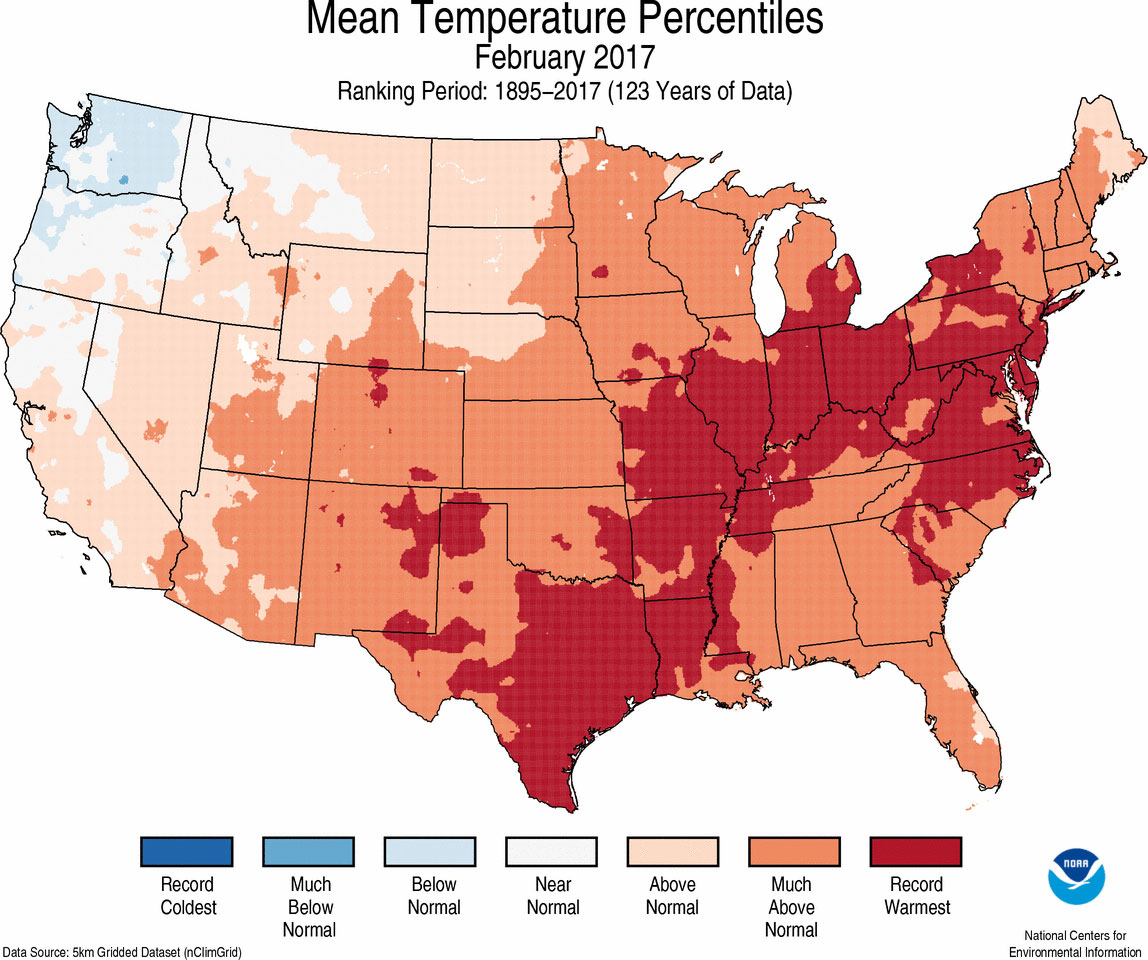
Most locations across the contiguous U.S. were warmer than average during February. Thirty-nine states from the Rockies to the East Coast were much warmer than average, with 16 states across the South, Midwest, Mid-Atlantic and Northeast record warm. Below- to near-average temperatures were observed for the Northwest, with no state ranking record cold.
-
A notable amount of station-level temperature records were broken during February, including numerous cities setting warm daily and monthly temperature records. There were 11,743 daily warm temperature records broken or tied, compared to 418 daily cold records. Of those, 1,151 daily records also broke the warmest temperature record ever observed during February, compared to just 2 cold records.
-
February Precipitation
-
Most of the western United States was wetter than average, with heavy precipitation causing widespread flooding and mudslides in California and Nevada forcing area residents to evacuate impacted areas. Above-average precipitation was also observed in parts of the Southern Plains and Great Lakes. Five states in the Northwest and Northern Rockies were much wetter than average. Above-average snowpack was observed for most mountain locations in the West at the end of the month, with record high totals in parts of the Central Rockies and Sierra Nevada Mountains.
-
Below-average precipitation was observed in the Midwest stretching into the Southeast and coastal Northeast, where 10 states were much drier than average. The above-average temperatures and below-average precipitation were accompanied by a marked lack of snow for many locations in the East. However, several winter storms early in the month blanketed parts of the Northeast and New England with snow.
-
According to the February 28 U.S. Drought Monitor report, 14.1 percent of the contiguous U.S. was in drought, down 0.5 percent compared to the end of January. Drought improved by several categories across California and Nevada, where a series of Pacific storms dumped heavy rain and snow with most reservoirs reaching capacity. Long-term drought conditions persisted across southern California. Drought also improved across parts of the Southern Plains and Northeast. Drought conditions deteriorated across the Mississippi River Valley, Mid-Atlantic, and Southeast. Drought developed on Hawaii’s Big Island, which had been drier than average for several months.
Winter Temperature
-
Much-above-average temperatures were observed from the Southern Rockies and Southern Plains to East Coast. Thirty-six states were much warmer than average, with Louisiana and Texas having their warmest winter on record, with temperatures 6.8°F and 5.7°F above average, respectively.
-
Near- and below-average winter temperatures were observed along the West Coast, Great Basin and Northern Rockies. Five states, mostly in the Northwest, had winter temperatures that were cooler than average. No state was record cold.
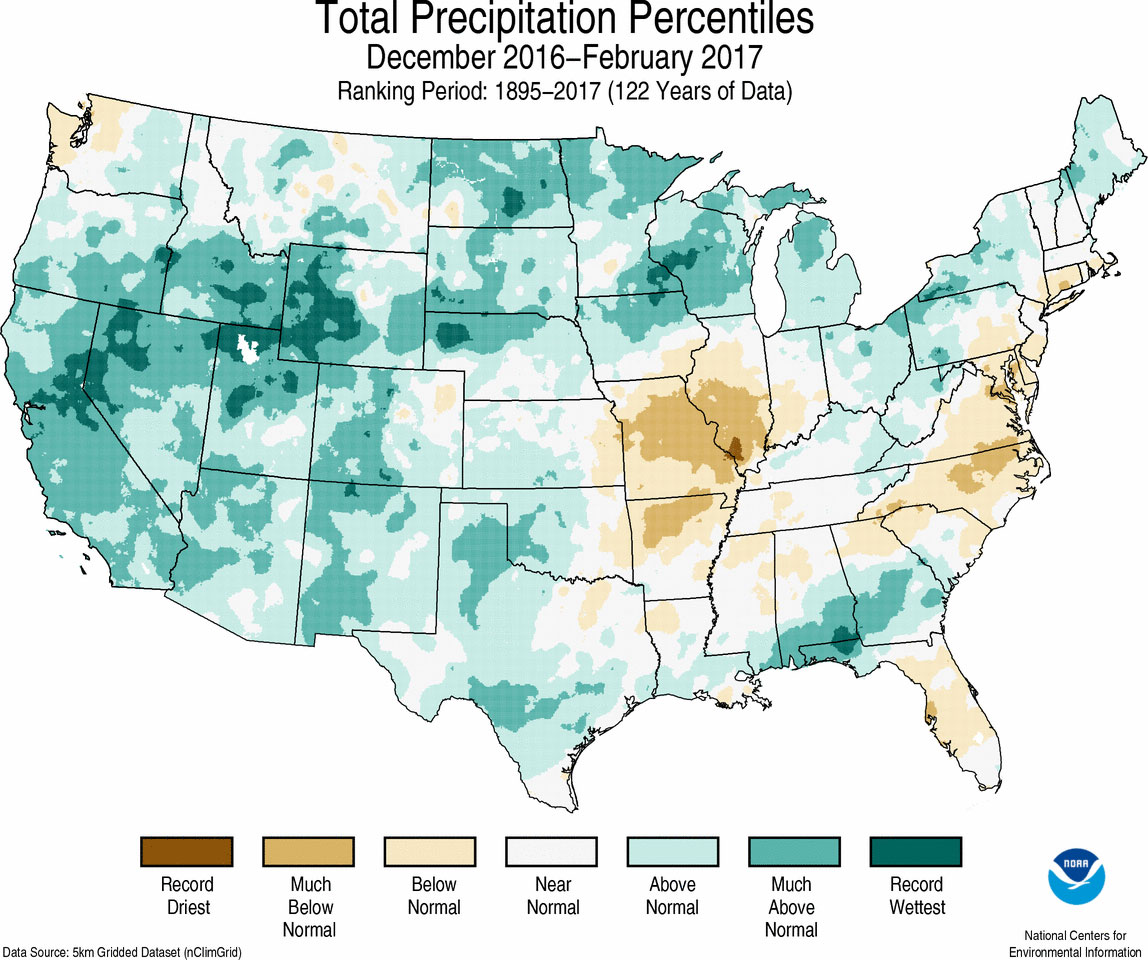
Winter Precipitation
-
Above-average precipitation spanned most of the West into the Northern Plains and Great Lakes, where 10 states were much wetter than average. Areas of above-average precipitation were also observed in the Central and Southern Plains, Southeast and Ohio Valley. Nevada and Wyoming had their wettest winter on record, with precipitation totals 194 percent and 179 percent of average, respectively. In contrast to recent winters, California had its second wettest December-February with 184 percent of average precipitation. Only the winter of 1969 was wetter for the state.
-
Below-average precipitation was observed in the mid-Mississippi River Valley and parts of the Mid-Atlantic and coastal Northeast. Missouri was much drier than average, but no state was record dry for winter.
Winter Extremes
-
The U.S. Climate Extremes Index (USCEI) for the winter was 75 percent above average and the seventh highest value on record. On the national scale, extremes in warm maximum and minimum temperatures, one-day precipitation totals and days with precipitation were much above average. Extremes in warm minimum temperatures were record high. The USCEI is an index that tracks extremes (falling in the upper or lower 10 percent of the record) in temperature, precipitation and drought across the contiguous U.S.
Additional Winter and February Information
The full U.S. report will be released on March 13.


