
The Mississippi River dropped to record lows this October

Key Points:
- For the second year in a row, the Mississippi River dropped to record lows, causing barges and ships to run aground during one of the busiest times of the year to ship grain.
- The first major cold snap of the season occurred on October 31 and into early November. Temperatures dropped 20–30°F below average across much of the U.S., resulting in record-low temperatures and snowfall from the Northwest to the Southeast.
- Year-to-date temperatures across the eastern U.S. have been warmer than average in 2023 with 30 states experiencing a top-10 warmest January–October.
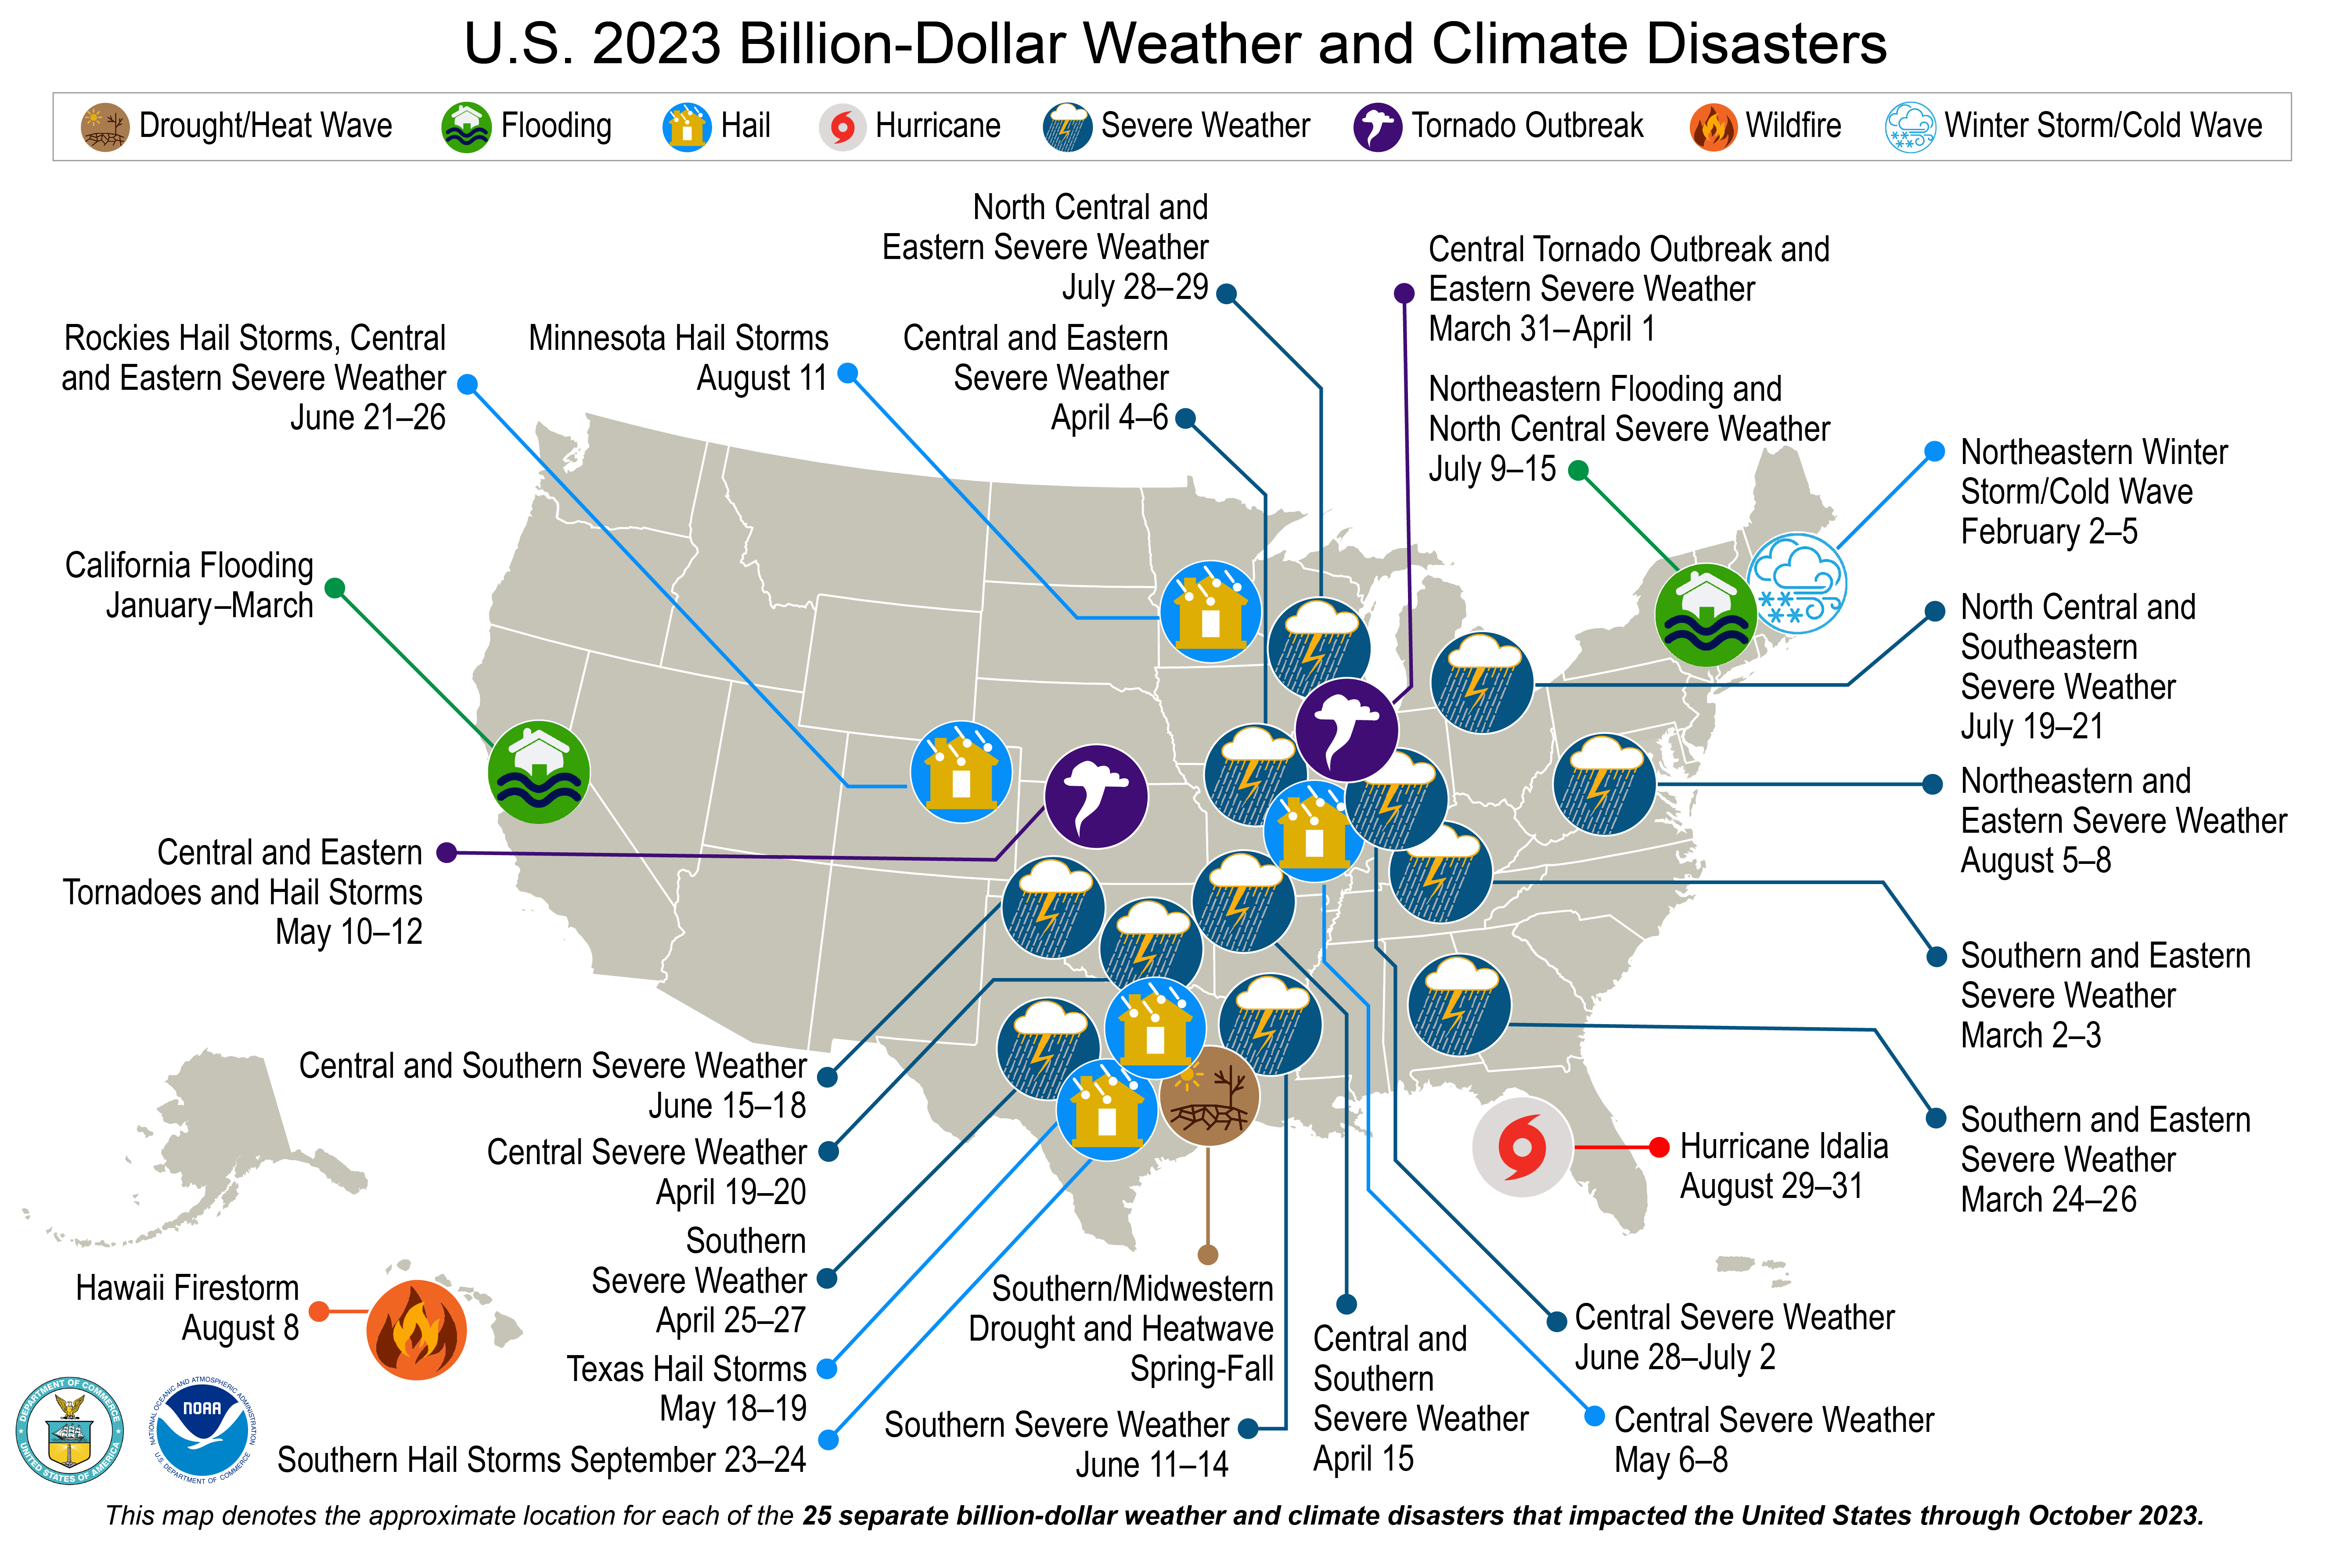
- A total of 25 separate billion-dollar weather and climate disasters have been confirmed this year—the most events on record during a calendar year.
- October 2023 was the 18th-warmest October on record for the nation, and precipitation ranked in the middle third of the historical record for the month.

Other Highlights:
Temperature
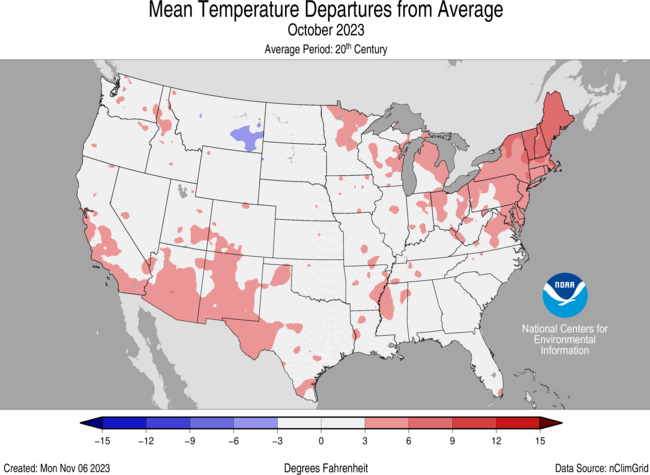
The average temperature of the contiguous U.S. in October was 56.1°F, 2.0°F above average, ranking 18th warmest in the 129-year record. Generally, October temperatures were above average across much of the contiguous U.S., with below-normal temperatures in parts of the central and northern Plains. Maine ranked second warmest on record for October while Vermont and New Hampshire each ranked third warmest on record. An additional six states ranked in their top-10 warmest October on record.
The Alaska statewide October temperature was 27.8°F, 2.3°F above the long-term average, ranking in the middle third of the 99-year period of record for the state. Near-normal temperatures were observed across much of the state with above-normal temperatures observed in parts of the Northwest, Southwest, the Aleutians and the Panhandle.
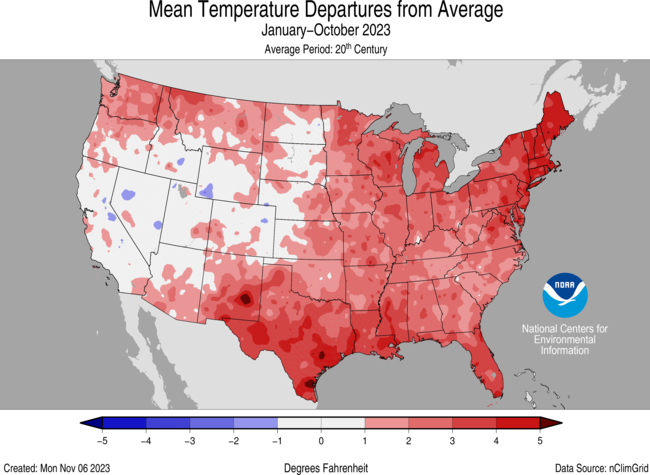
For January–October, the average contiguous U.S. temperature was 56.9°F, 1.9°F above average, ranking 11th warmest on record for this period. Temperatures were above average from parts of the Southwest to the East Coast and along much of the Northern Tier, with near- to below-average temperatures in parts of the northern Plains to the West Coast. Texas, Louisiana, Mississippi and Florida each ranked warmest on record while Maine, New Hampshire, Vermont, Massachusetts, Rhode Island, Connecticut, New Jersey and Maryland each ranked second warmest for the January–October period. An additional 18 states had a top-10 warmest year-to-date period. No state experienced a top-10 coldest January–October.
The Alaska January–October temperature was 31.5°F, 1.9°F above the long-term average, ranking in the warmest third of the historical record for the state. Much of the state was above normal for the 10-month period while temperatures were near average across the western, south-central and interior parts of the state.
Precipitation
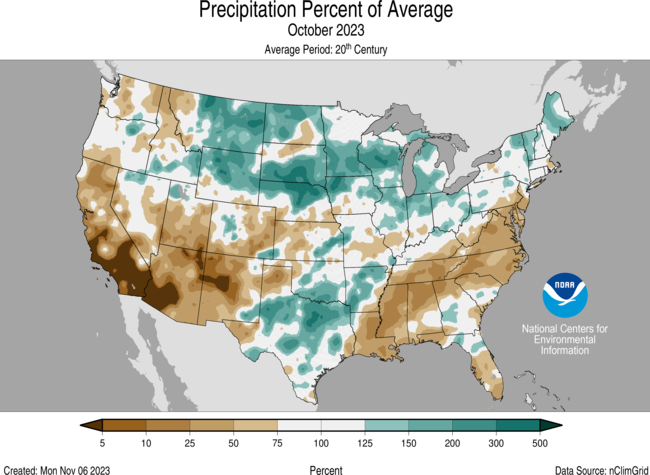
October precipitation for the contiguous U.S. was 2.14 inches, 0.05 inch below average, ranking in the middle third of the historical record. Precipitation was below average from the Lower Mississippi Valley to parts of the Mid-Atlantic and in parts of the Northwest, Southwest, central Plains and Southeast. Precipitation was above average from the northern Rockies to the Great Lakes and in parts of the southern Plains, Southeast and Northeast. No state ranked in their top-10 wettest October on record for this period. On the dry side, North Carolina ranked 10th driest on record for the month.
Across the state of Alaska, the average monthly precipitation was 4.06 inches, ranking in the middle third of the historical record. Precipitation was above average in parts of the North Slope, West Coast, eastern Interior and a small part of the northern Panhandle. Below-normal precipitation was observed in the Southwest, including the Aleutians, south-central Alaska and in southern parts of the Panhandle during the month.
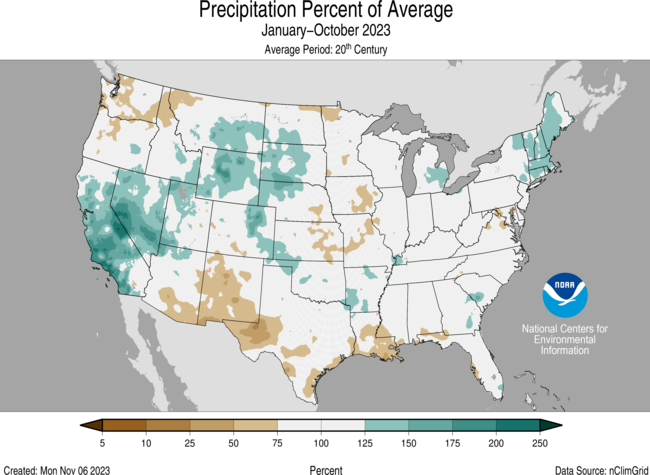
The January–October precipitation total for the contiguous U.S. was 25.50 inches, 0.14 inch above average, ranking in the middle third of the 129-year record. Precipitation was near to above average across much of the Northeast, from California to the western Plains, as well as in parts of the southern Plains, Great Lakes and Southeast. Wyoming and Massachusetts each ranked fourth wettest while Nevada, Maine and Connecticut each ranked fifth wettest on record for this year-to-date period. Two additional states ranked among their top-10 wettest for this period. Conversely, precipitation was below average along parts of the Northwest, Southwest, upper and central Mississippi Valley, Mid-Atlantic and along the Gulf of Mexico during the January–October period. Maryland ranked seventh driest, while Washington ranked 10th driest for this 10-month period.
The January–October precipitation ranked 15th wettest in the 99-year record for Alaska, with above-average precipitation observed across much of the state. Near-normal precipitation was observed along parts of the Gulf of Alaska, while parts of the Aleutians experienced below-average precipitation during this period.
Billion-Dollar Disasters

One new billion-dollar weather and climate disaster was confirmed this month after Southern hail storms brought severe weather to parts of the southern Plains on September 23–24.
There have been 25 confirmed weather and climate disaster events this year, each with losses exceeding $1 billion. These disasters consisted of 19 severe storm events, two flooding events, one tropical cyclone, one winter storm, one wildfire and one drought and heatwave event. For this year-to-date period, the first 10 months of 2023 rank highest for disaster count, ahead of those of 2020 which saw 19 disasters. The total cost of the 2023 events exceeds $73.8 billion, and they have resulted in 464 direct and indirect fatalities.
The U.S. has sustained 373 separate weather and climate disasters since 1980 where overall damages/costs reached or exceeded $1 billion (including CPI adjustment to 2023). The total cost of these 373 events exceeds $2.645 trillion.
Other Notable Events
- Persistent heat brought record-breaking temperatures to portions of the U.S. during October:
A total of 317 counties had their warmest January–October on record while an additional 1498 counties ranked in the top-10 warmest for the year-to-date period. There are 3,143 counties in the U.S. - During early October, record warmth impacted parts of the Northeast. On October 4, the Burlington Airport in Vermont reached 86°F and set a new all-time October record high temperature—breaking a long-standing record high temperature of 82 set back in 1891.
- Above-normal temperatures persisted across much of Puerto Rico during the month of October. San Juan International Airport reported a monthly average temperature of 85.4°F, making it the hottest October on record and the fifth-warmest month on record.
- Warm temperatures and lack of rainfall during 2023 resulted in expansion of drought coverage and intensity across parts of the Mississippi Valley, leading to record low water levels along parts of the Mississippi River that caused barges to run aground and created saltwater intrusion concerns in southern Louisiana.
Heavy precipitation and snow brought one of the wettest water years—October to September—on record for the state of California, causing the state's reservoirs to rise to 128% of their historical average.
Drought expanded in coverage and intensity across the islands of Hawaii during October. On October 24, drought covered 94.8% of the state—the greatest extent of drought in the 2000-2023 period of record for the U.S. Drought Monitor.
Drought
According to the October 31 U.S. Drought Monitor report, about 36.5% of the contiguous U.S. was in drought, down about 3.6% from the beginning of October. Moderate to exceptional drought was widespread across much of the central to southern Great Plains, Lower Mississippi Valley and Southwest, with moderate to extreme drought across the Northwest, Tennessee Valley, Hawaii and in parts of the Florida Peninsula. Moderate to severe drought was present in parts of the Mid-Atlantic and New York, as well as moderate drought in parts of the Great Lakes and Puerto Rico.
Drought conditions expanded or intensified across much of the Southeast and Tennessee Valley as well as in parts of the Southwest, Mid-Atlantic and Hawaii this month. Drought contracted or was reduced in intensity across much of the Plains and Great Lakes and in portions of the Northern Tier and Puerto Rico.
Monthly Outlook
According to the October 31 One-Month Outlook from the Climate Prediction Center, above-normal monthly average temperatures are favored for much of the western U.S., along the Gulf Coast states and much of Alaska in November, with the greatest odds for parts of the southwestern U.S. and northern Alaska. Below-normal temperatures are forecast for parts of the Northeast this month. Portions of the Northwest, Southeast and northern Alaska are favored to see above-normal monthly total precipitation while below-normal precipitation is most likely to occur from the Lower Mississippi Valley to the Great Lakes and in parts of Southwest Alaska. Drought improvement or removal is forecast along parts of the Pacific Northwest coast and in parts of the Midwest, southern Plains and Puerto Rico, while persistence is more likely across the Northern Tier, Southwest, Mississippi Valley, Ohio Valley, Mid-Atlantic and Hawaii. Drought development is likely in parts of the Southeast.
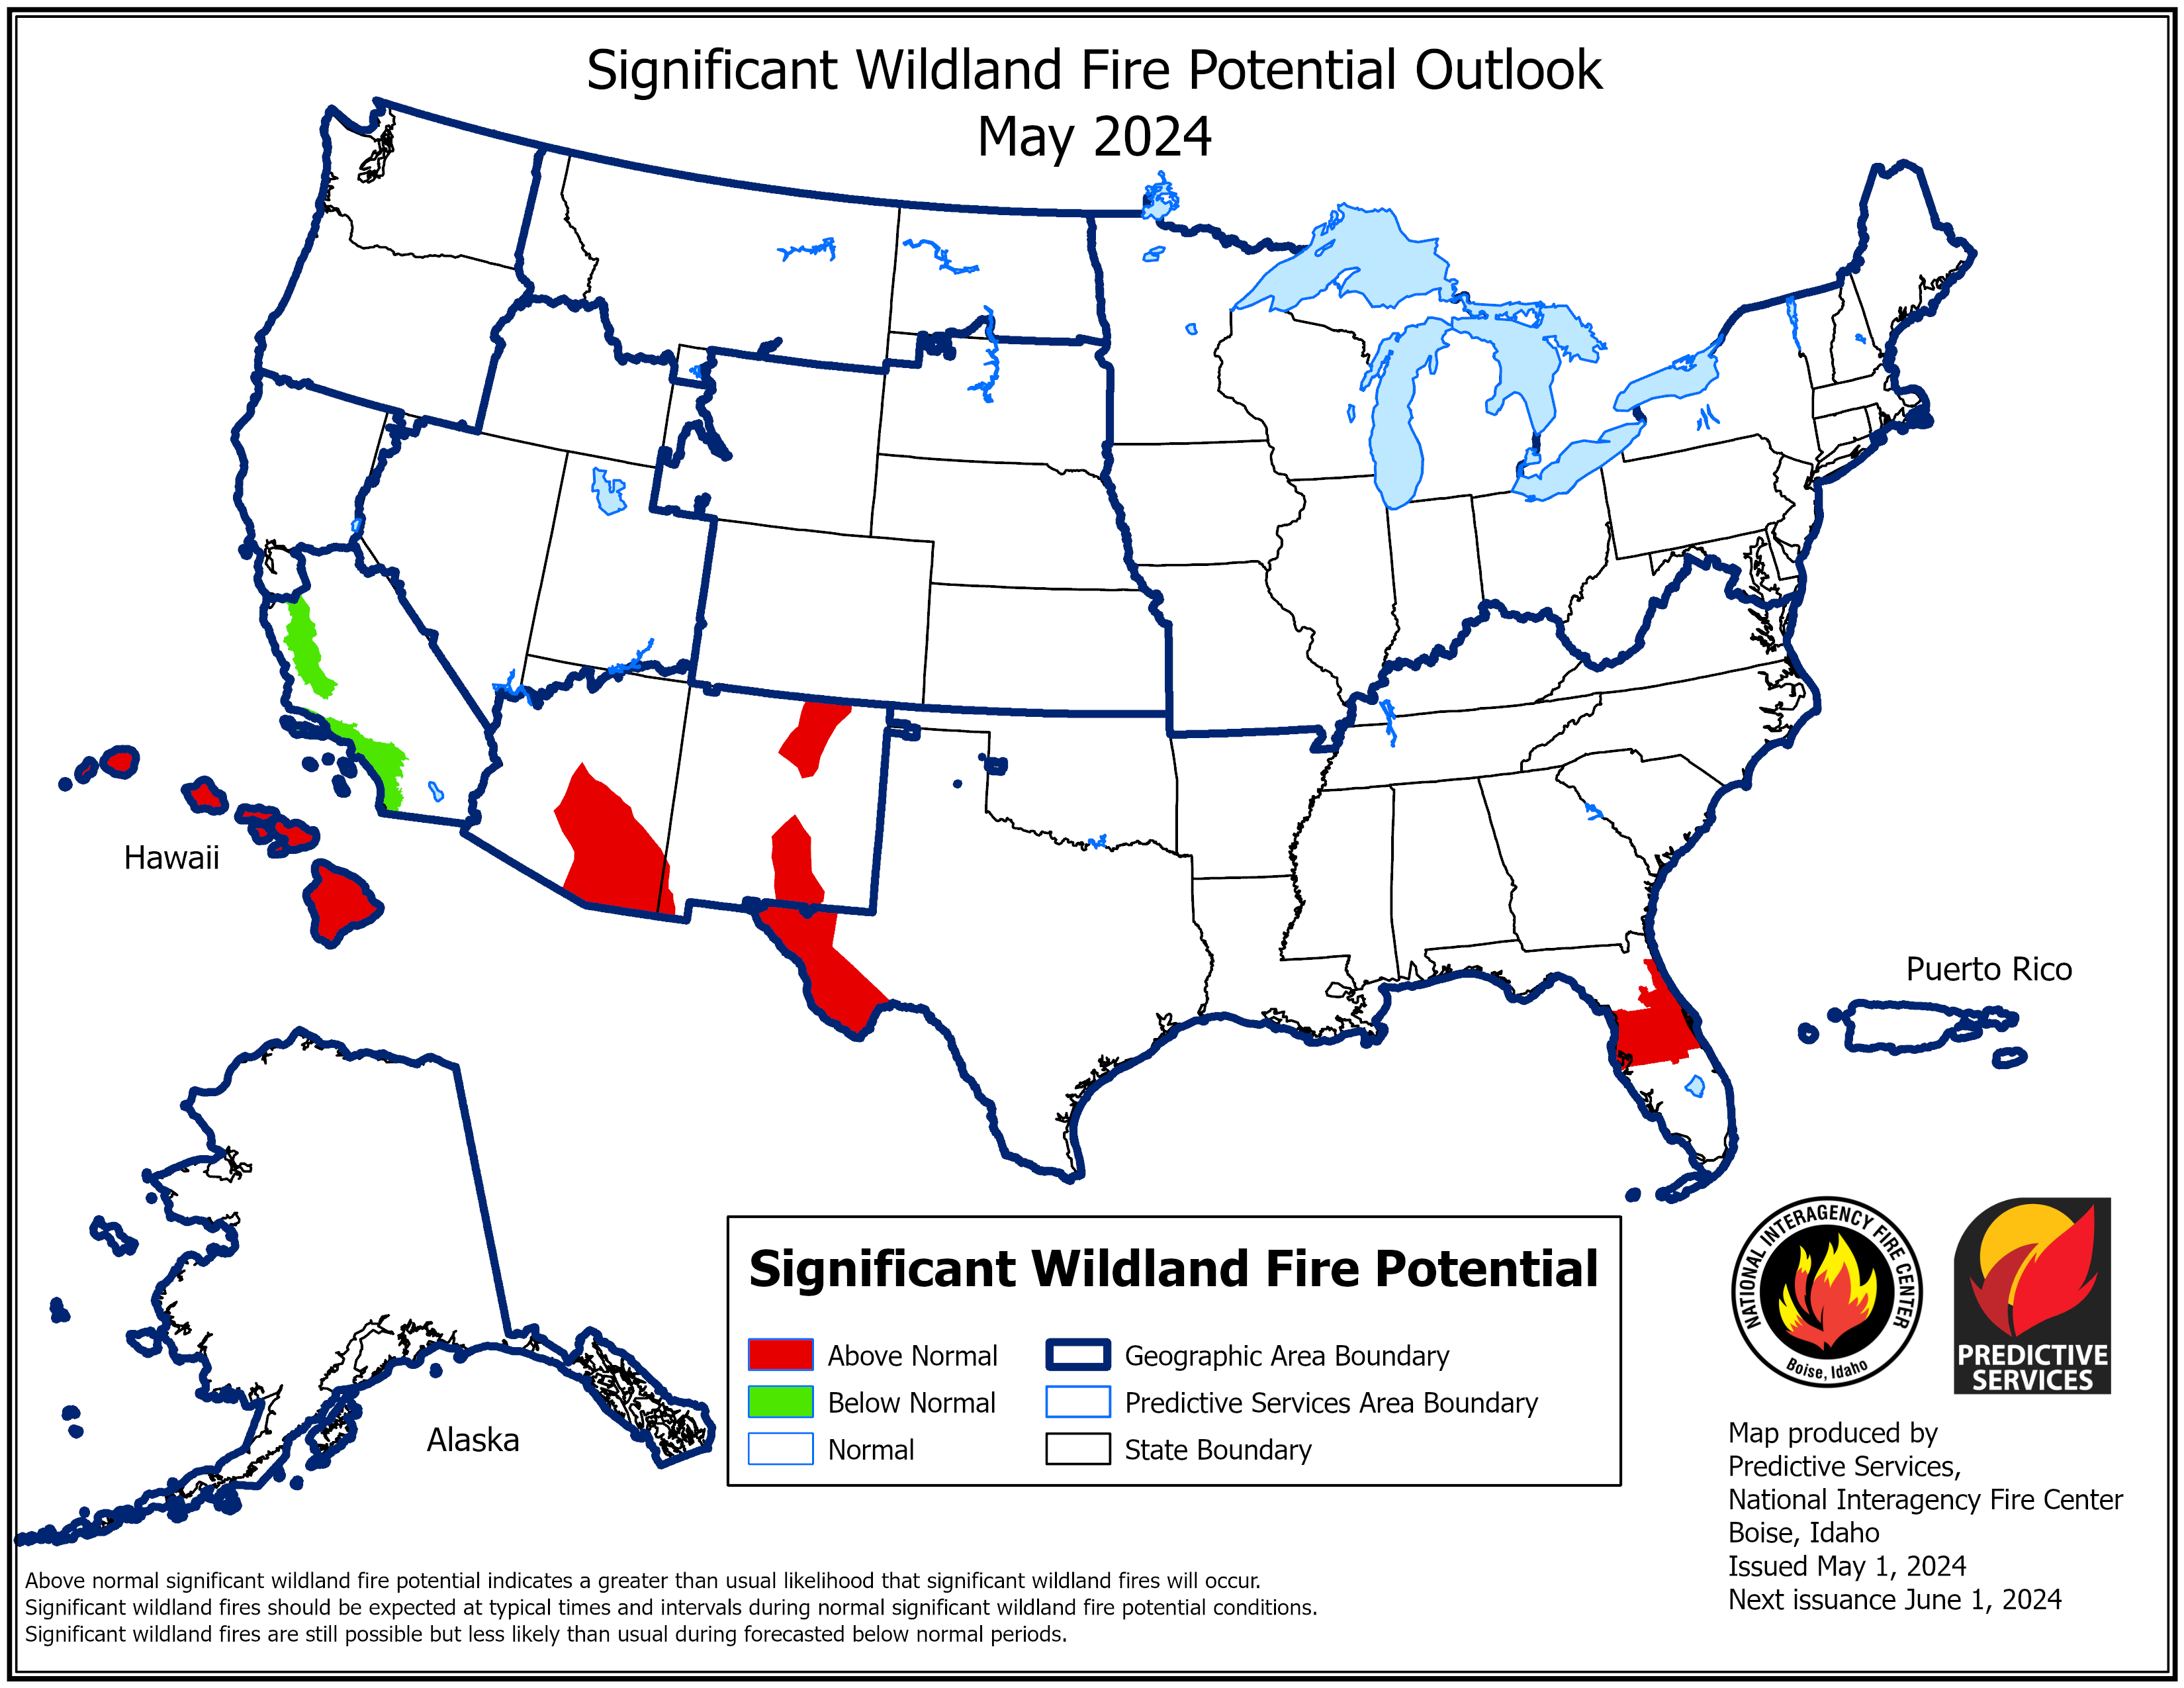
According to the One-Month Outlook issued on December 1 from the National Interagency Fire Center, Hawaii and parts of the Lower Mississippi Valley have above-normal significant wildland fire potential during November, while parts of eastern Oklahoma and western Arkansas are expected to have below-normal potential for the month.
This monthly summary from NOAA’s National Centers for Environmental Information is part of the suite of climate services NOAA provides to government, business, academia and the public to support informed decision-making. For more detailed climate information, check out our comprehensive October 2023 U.S. Climate Report scheduled for release on November 14, 2023. For additional information on the statistics provided here, visit the Climate at a Glance and National Maps webpages.


