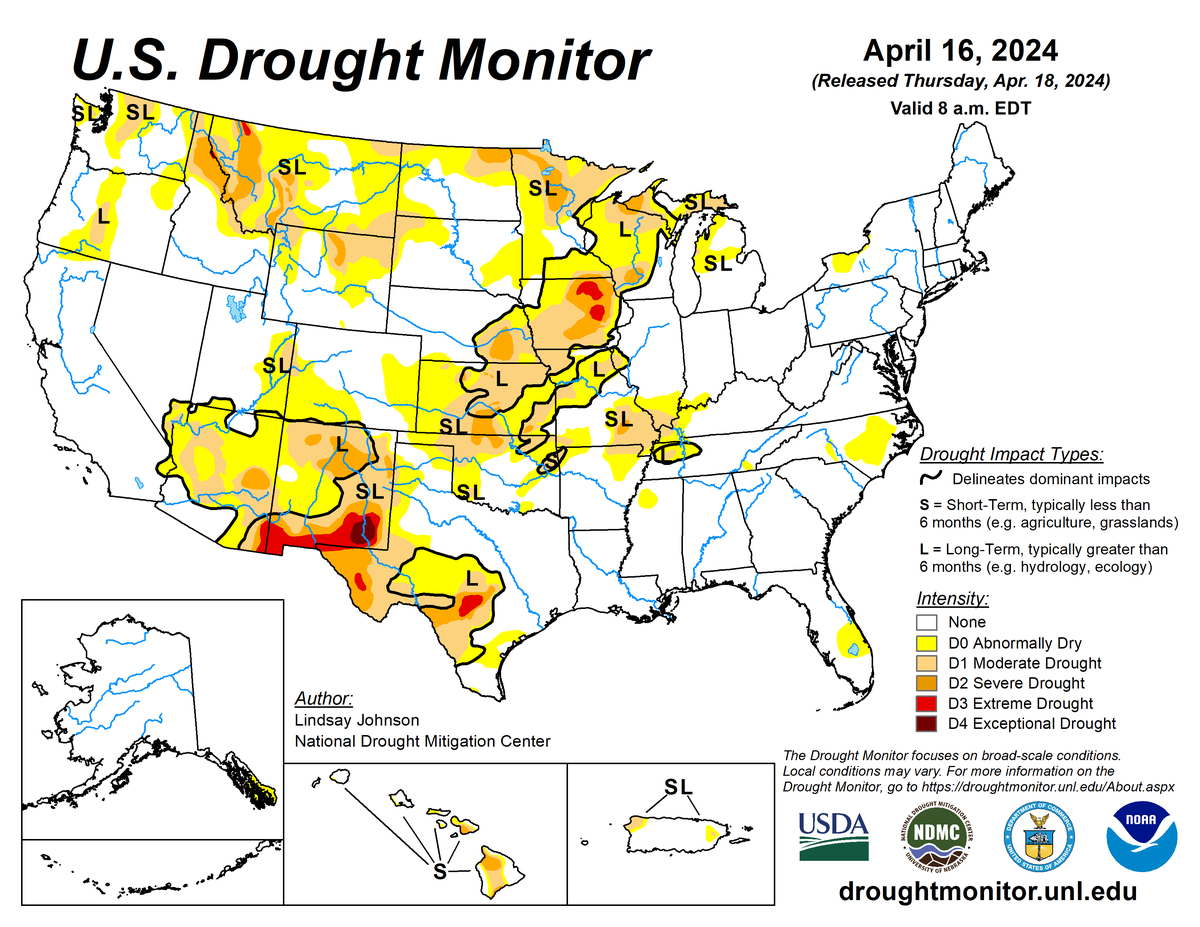
According to the April 16, 2024 U.S. Drought Monitor (USDM), moderate to exceptional drought covers 15.0% of the United States including Puerto Rico, an increase from last week’s 14.7%. The worst drought categories (extreme to exceptional drought) stayed about the same as last week’s 0.9%.
Two strong upper-level weather systems (low-pressure troughs) moved across the contiguous U.S. during this USDM week (April 10–16). They were preceded and followed by upper-level ridges in what is termed a highly meridional jet-stream flow. The troughs were associated with surface cold fronts and low-pressure systems that generated areas of rain (and snow at higher elevations) as well as bouts of severe weather. Above-normal precipitation fell over much of California and parts of Oregon, across the Lower Mississippi Valley and coastal Southeast, in parts of the northern Plains, and from the Ohio and Mid-Mississippi Valleys and Appalachians to New England, as well as over the western and northern islands of Hawaii.
Much of the West, Great Plains, and Upper Mississippi Valley, and parts of the Mid-Atlantic coast and southern Florida, were drier than normal. Temperatures for the week were controlled by the upper-level ridges, with most of the contiguous U.S. averaging warmer than normal; only parts of the southern tier states averaged near to cooler than normal. Drought or abnormal dryness contracted or was reduced in intensity in parts of the Pacific Northwest, the northern High Plains, the Midwest, Puerto Rico, and Hawaii.
Drought or abnormal dryness expanded or intensified in the central and southern Plains and parts of North Carolina and Florida. Nationally, expansion exceeded contraction, so the nationwide moderate-to-exceptional drought area increased this week.
Abnormal dryness and drought are currently affecting over 47 million people across the United States including Puerto Rico—about 15.1% of the population.

The full U.S. Drought Monitor weekly update is available from Drought.gov
In addition to Drought.gov, you can find further information on the current drought on this week’s Drought Monitor update at the National Drought Mitigation Center
The most recent U.S. Drought Outlook is available from NOAA’s Climate Prediction Center. The U.S. Department of Agriculture’s World Agriculture Outlook Board also provides information about the drought’s influence on crops and livestock
For additional drought information, follow #DroughtMonitor on Facebook and X


