
NCEI has acquired legacy solar irradiance datasets from multiple sources over many decades. These data are provided here, ‘as is,’ and in most cases the linked documentation is the entirety of available information at NCEI. Newer versions of some of these datasets and models may be available elsewhere. In some cases, older data may also be found in the Space Weather Legacy Print Publications.
Current datasets of Spectral and Total Solar Irradiance (SSI and TSI, respectively) are considered NOAA Climate Data Records (CDRs) and can be found at the links below:
Questions and comments about the legacy data presented here may be directed to ncei.info@noaa.gov.
Solar Ultraviolet Spectral Irradiance Datasets
The ultraviolet (UV) part of the electromagnetic spectrum ranges between 5 and 400 nanometers (nm). As the SORCE (Solar Radiation and Climate Experiment satellite) mission stated, far UV irradiance from the Sun varies by as much as 10 percent during the Sun's 27-day rotation, while the bright 121.6 nm hydrogen Lyman-alpha emission may vary by as much as a factor of 2 during an 11-year solar cycle, dramatically affecting the energy input into the Earth's atmosphere.
NCEI archives older solar UV spectral irradiance data, ‘as is,’ and in most cases the only available information is in the linked documentation. See the drop-downs below for more information on each of the archived legacy datasets.
- NOAA Mg II core-to-wing daily index - version 9.1 [.dat] (1978-2007) - data provided by Rodney.Viereck@noaa.gov.
- NIMBUS7 MgII core-to-wing ratio data [.plt] [read me doc file] (1978-1984) - by Donnelly, RF. Data presented at "Solar UV Data Sets for Atmospheric Research", at the XIX General Assembly of the International Union of Geodesy and Geophysics, in Vancouver, Canada. August, 1987. Not normalized to solar cycle minimum. Mg II ratios for Nimbus-7 have been published in Solar-Geophysical Data (SGD), Comprehensive Reports, No. 542 Part II, pp. 82 - 91, Oct. 1989.
- NIMBUS-7 and NOAA-9 MgII core-to-wing ratio data [.plt] (1978-1984: NIMBUS-7; 1986-1988: NOAA-9). NIMBUS7 data is not normalized to solar cycle minimum. The Mg II ratios presented here are derived from the discrete-wavelength mode measurements of the SBUV2 monitor aboard the NOAA-9 satellite. A modified ratio has been used to reduce noise and those values have been converted to equivalent Nimbus-7 values using a linear regression relation (Donnelly, 1990, 1991). These results supersede earlier results published in SGD No. 529 - Part II, pp. 74-75, Sept. 1988, and No. 541 - Part II, pp. 178-180.
- NOAA-9 classical discrete MgII index - version 2 [.txt] (1986-1997) [read me file] - by Dr. R. Cebula and M. DeLand.
- NOAA-11 classical discrete MgII Index - versions 1 and2 [.txt] (1989-1994) [read me file] - by Dr. R. Cebula and M. DeLand.
- SUSIM/UARS MgII core-to-wing daily index - version 19r2 [.dat] (1991 - 1997) - by G. Brueckner, D. Prinz, L. Floyd. The Solar Ultraviolet Spectral Irradiance Monitor on the Upper Atmospheric Research Satellite (SUSIM/UARS) measured the absolute irradiance of the UV solar emission in the 110 to 410 nm range between 1991 and 2005. The SUSIM Mg II index was computed from the daily mid-resolution spectrum in the vicinity of 280 nm. At this spectral resolution (1.1 nm FWHM, sampled every ~0.24 nm) the Mg II absorption doublet and the chromospheric emission line in the core of each absorption line, are blended so that the feature appears to be a single absorption "line". The SUSIM Mg II index is a ratio of a measure of the "core" of the feature to a similar measure of the wings of the feature.
- SOLSTICE/UARS MgII index and SSI - version 7 [.dat] (1991-1994) [read me] - by G. Rottman. The Solar-Stellar Irradiance Comparison Experiment instrument abord the Upper Atmosphere Research Satellite (SOLSTICE/UARS)measured the solar ultraviolet spectra in the 119 nm - 420 nm range between 1991 and 2001. The version 7 data (from Oct 1994) presented here include Mg II 280.0 nm and Ca II 393.3 nm core-to-wing ratios, Hydrogen I Lyman alpha 121.6 nm intensities, and 200-205 nm summed intensities. Only selected years (1991-1994) of data are available here.
- Composite MgII core-to-wing daily index [.dat] (1978-1993) [read me file] - by Dr. R. Cebula and M. DeLand.
The Mg II core-to-wing ratio was developed by Heath and Schlesinger (1986) for use with the solar ultraviolet measurements from the Solar Backscatter Ultraviolet (SBUV) experiment on the Nimbus-7 satellite. The Mg II core-to-wing ratio is derived from the ratio of the h and k lines of the solar Mg II feature at 280 nm to the background or wings at approximately 278 nm and 282 nm (from multiple satellites). The h and k lines are variable chromospheric emissions while the background emissions are more stable. The result is a robust measure of chromospheric activity. The ratio is a good measure of solar UV and EUV emissions.
References:
- Donnelly, R.F., Solar UV Spectral Irradiance Variations, J.
Geomagnetism and Geoelectricity, 43, Suppl. Is., 8 pp., 1991. - Donnelly, R.F., Solar UV Temporal Variations During Solar Cycle
22 & The Twentieth Century, Climate Impact of Solar Varia-
bility, NASA Conf. Publ. 3086, ed K.H. Schatten and A.
Arking, NASA GSFC, Greenbelt, MD, 328-335, 1990. - Heath, D.F., and B.M. Schlesinger, The Mg 280-nm Doublet as a
Monitor of Changes in Solar Ultraviolet Irradiance, J.
Geophys. Res., 91, 8672-8682, 1986. - Viereck and Puga, The NOAA Mg II core-to-wing solar index: construction of a 20-year time series of chromospheric variability from multiple satellites., JGR, 104, pp 9995-10005, May 1999.
- Viereck et al., The Mg II Index: A proxy for Solar EUV., GRL, 28, pp 1343-1346, April 2001.
- SSI [200 - 2495 nm] - NASA CV-900 aircraft [.dat] (1969) - data provided by John C. Arveson (NASA/Ames)
Dataset is the result of an experiment to determine extraterrestrial solar spectral irradiance at the Earth's mean solar distance within the 300-2500 nm wavelength region. Spectroradiometric measurements were performed during eleven research flights on board a NASA CV-990 aircraft at altitudes between 11.6 km and 12.5 km.
Reference:
- Original SERF1 data files (1977 - 1981) [read me doc file]- developed by Dr. Hans Hinteregger. The spectra and model are based on rocket measurements and simultaneously obtained EUV fluxes by the Atmospheric Explorer (AE)-C and AE-E spectrometer. The rocket measurements were used to establish absolute calibration factors for the AE-E instrument. This data is available for historical purposes and includes several caveats and problems (see SERF1_STATUS.doc). Solar spectrum experts met in Boulder on Aug 08, 2001 and encouraged the use of the SOLAR2000 EUV spectrum model instead of SERF1. SOLAR2000 irradiance specification tool is now integrated to Space Environment Technologies - Solar Irradiance Platform (SET/SIP).
- SERF2 data files (1981 - 1989) [read me txt file] - developed by Dr. Tobiska. SERF2 represented an advance for empirical solar EUV irradiance modeling based upon 1) the extension of the EUV class method to time periods outside of the AE-E dataset and 2) the high correlations of the Lyman-alpha and F10.7 proxies with the AE-E chromospheric and coronal irradiances, respectively.
References:
- Hinteregger, H.E., Original explanation of the EUV-reference spectrum and notes of the EUV flux observations
- Hinteregger, H. E., K. Fukui, B. G. Gilson, Observational, reference and model data on solar EUV, from measurements on AE-E, Geophys. Res. Lett., 8, 1147–1150, 1981.
- Tobiska, W.K., SERF2: A solar extreme ultraviolet flux model, Earth and Planetary Atmospheres Group, Space Sciences Laboratory, University of California, Berkeley, Contribution 9, (1990)
- SME Daily Lyman-alpha flux files (1982-1989) [read me file] - data from the University of Colorado. These files contain Lyman-alpha fluxes measured daily with the University of Colorado's Solar Mesosphere Explorer (SME) Satellite, between 01/01/1982 and 03/31/1989 at a resolution of 1 nm.
Lyman-alpha is a strong emission line of hydrogen in the sun's radiation spectrum at the ultraviolet wavelength of 121.5 nanometers. Variations in its intensity track the erratic 11-year rise and fall of solar activity.
SSI mid-UV balloon flight data (1978 and 1983) - by G. Anderson and L. Hall (AFGL). [read me]
The measurements were made from a balloon near 40 km and have been extrapolated to zero optical depth by correcting for ozone, O2 Herzberg continuum absorption, and Rayleigh scattering. No correction has been made for Schumann-Runge absorption, so there remains some slight signature from the 0-0 and 1-0 bands of that system near 200 and 202.5 nm, respectively.
References:
- Pioneer-Venus Orbiter Langmuir Probe database (1979-1992) - date is YYYYMMDD and the Ipe photocurrent from the Pioneer Venus Orbiter Langmuir Probe is given in nanoamps. This is the D. Pesnell and W. Hoegy dataset. [read me]
There are 4096 data values, with gaps up to 37 days in length. The solar rotation period is roughly 29 days when viewed from Venus, not 27 days as seen from Earth.
Temperature-dependent S/R band cross sections - This is the G. P. Anderson dataset. [read me]
The three archived files contain polynomial coefficients for generating oxygen Schumann-Runge (S/R) cross sections in the UV band. The coefficients span the spectral range 49,000 to 57,000 cm-1, recorded at 0.5 cm-1 intervals. Calculated cross sections will represent S/R band and continuum cross sections only. The Herzberg continuum cross section, if desired, must be added separately. See the appendix in the readme file for a typical Fortran program for an isothermal path.
Reference:
- Minschwaner, K., G.P. Anderson, L.A. Hall, and K. Yoshino, Polynomial Coefficients for Calculating O2 Schumann-Runge Cross Sections at 0.5 cm-1 Resolution, J. Geophys. Res., Vol 97, pp. 10.103-10.108, 1992.
TSI Composite Database
Radiometrically, the composite is based on the Active Cavity Radiometer Irradiance Monitor (ACRIM-I and II) records collected before the start of the ACRIM-I measurements in1980, during the spin mode of Solar Maximum Mission (SMM), and bridging the gap between ACRIM-I and II. Corrected data are inserted by shifting the level to fit the corresponding ACRIM data over an overlapping period of 250 days on each side of the ACRIM sets. In early 1996, the Variability of Solar Irradiance and Gravity Oscillations (VIRGO) data collection satellite took over and shifted to agree with ACRIM-II. Finally the composite records are adjusted via ACRIM-II to SARR (Space Absolute Radiometer Reference) which was introduced by Commelynck et al. (1995) and allows for the comparison of different space experiments. The data from the Earth Radiation Budget Experiment (ERBE) and ACRIM-III, as well as an empirical model, are used for comparisons and for internal consistency checks.
TSI Composite Database and Plots (1978 - 1999)
Active Cavity Radiometer Irradiance Monitor (ACRIM)
The Active Cavity Radiometer Irradiance Monitor (ACRIM) measured the total variability of solar irradiance with active cavity radiometer solar monitoring sensors on several satellites. The ACRIM Composite Total Solar Irradiance (TSI) Time Series Database was compiled from many satellite TSI data from 1978-2001 by Richard Wilson. The dataset and related information including plot are in the directory ACRIM3 composite. ACRIM 3 was successfully launched on board the NASA ACRIMSAT spacecraft on December 20, 1999. The ACRIM composite time series is constructed from combinations of satellite TSI data sets.
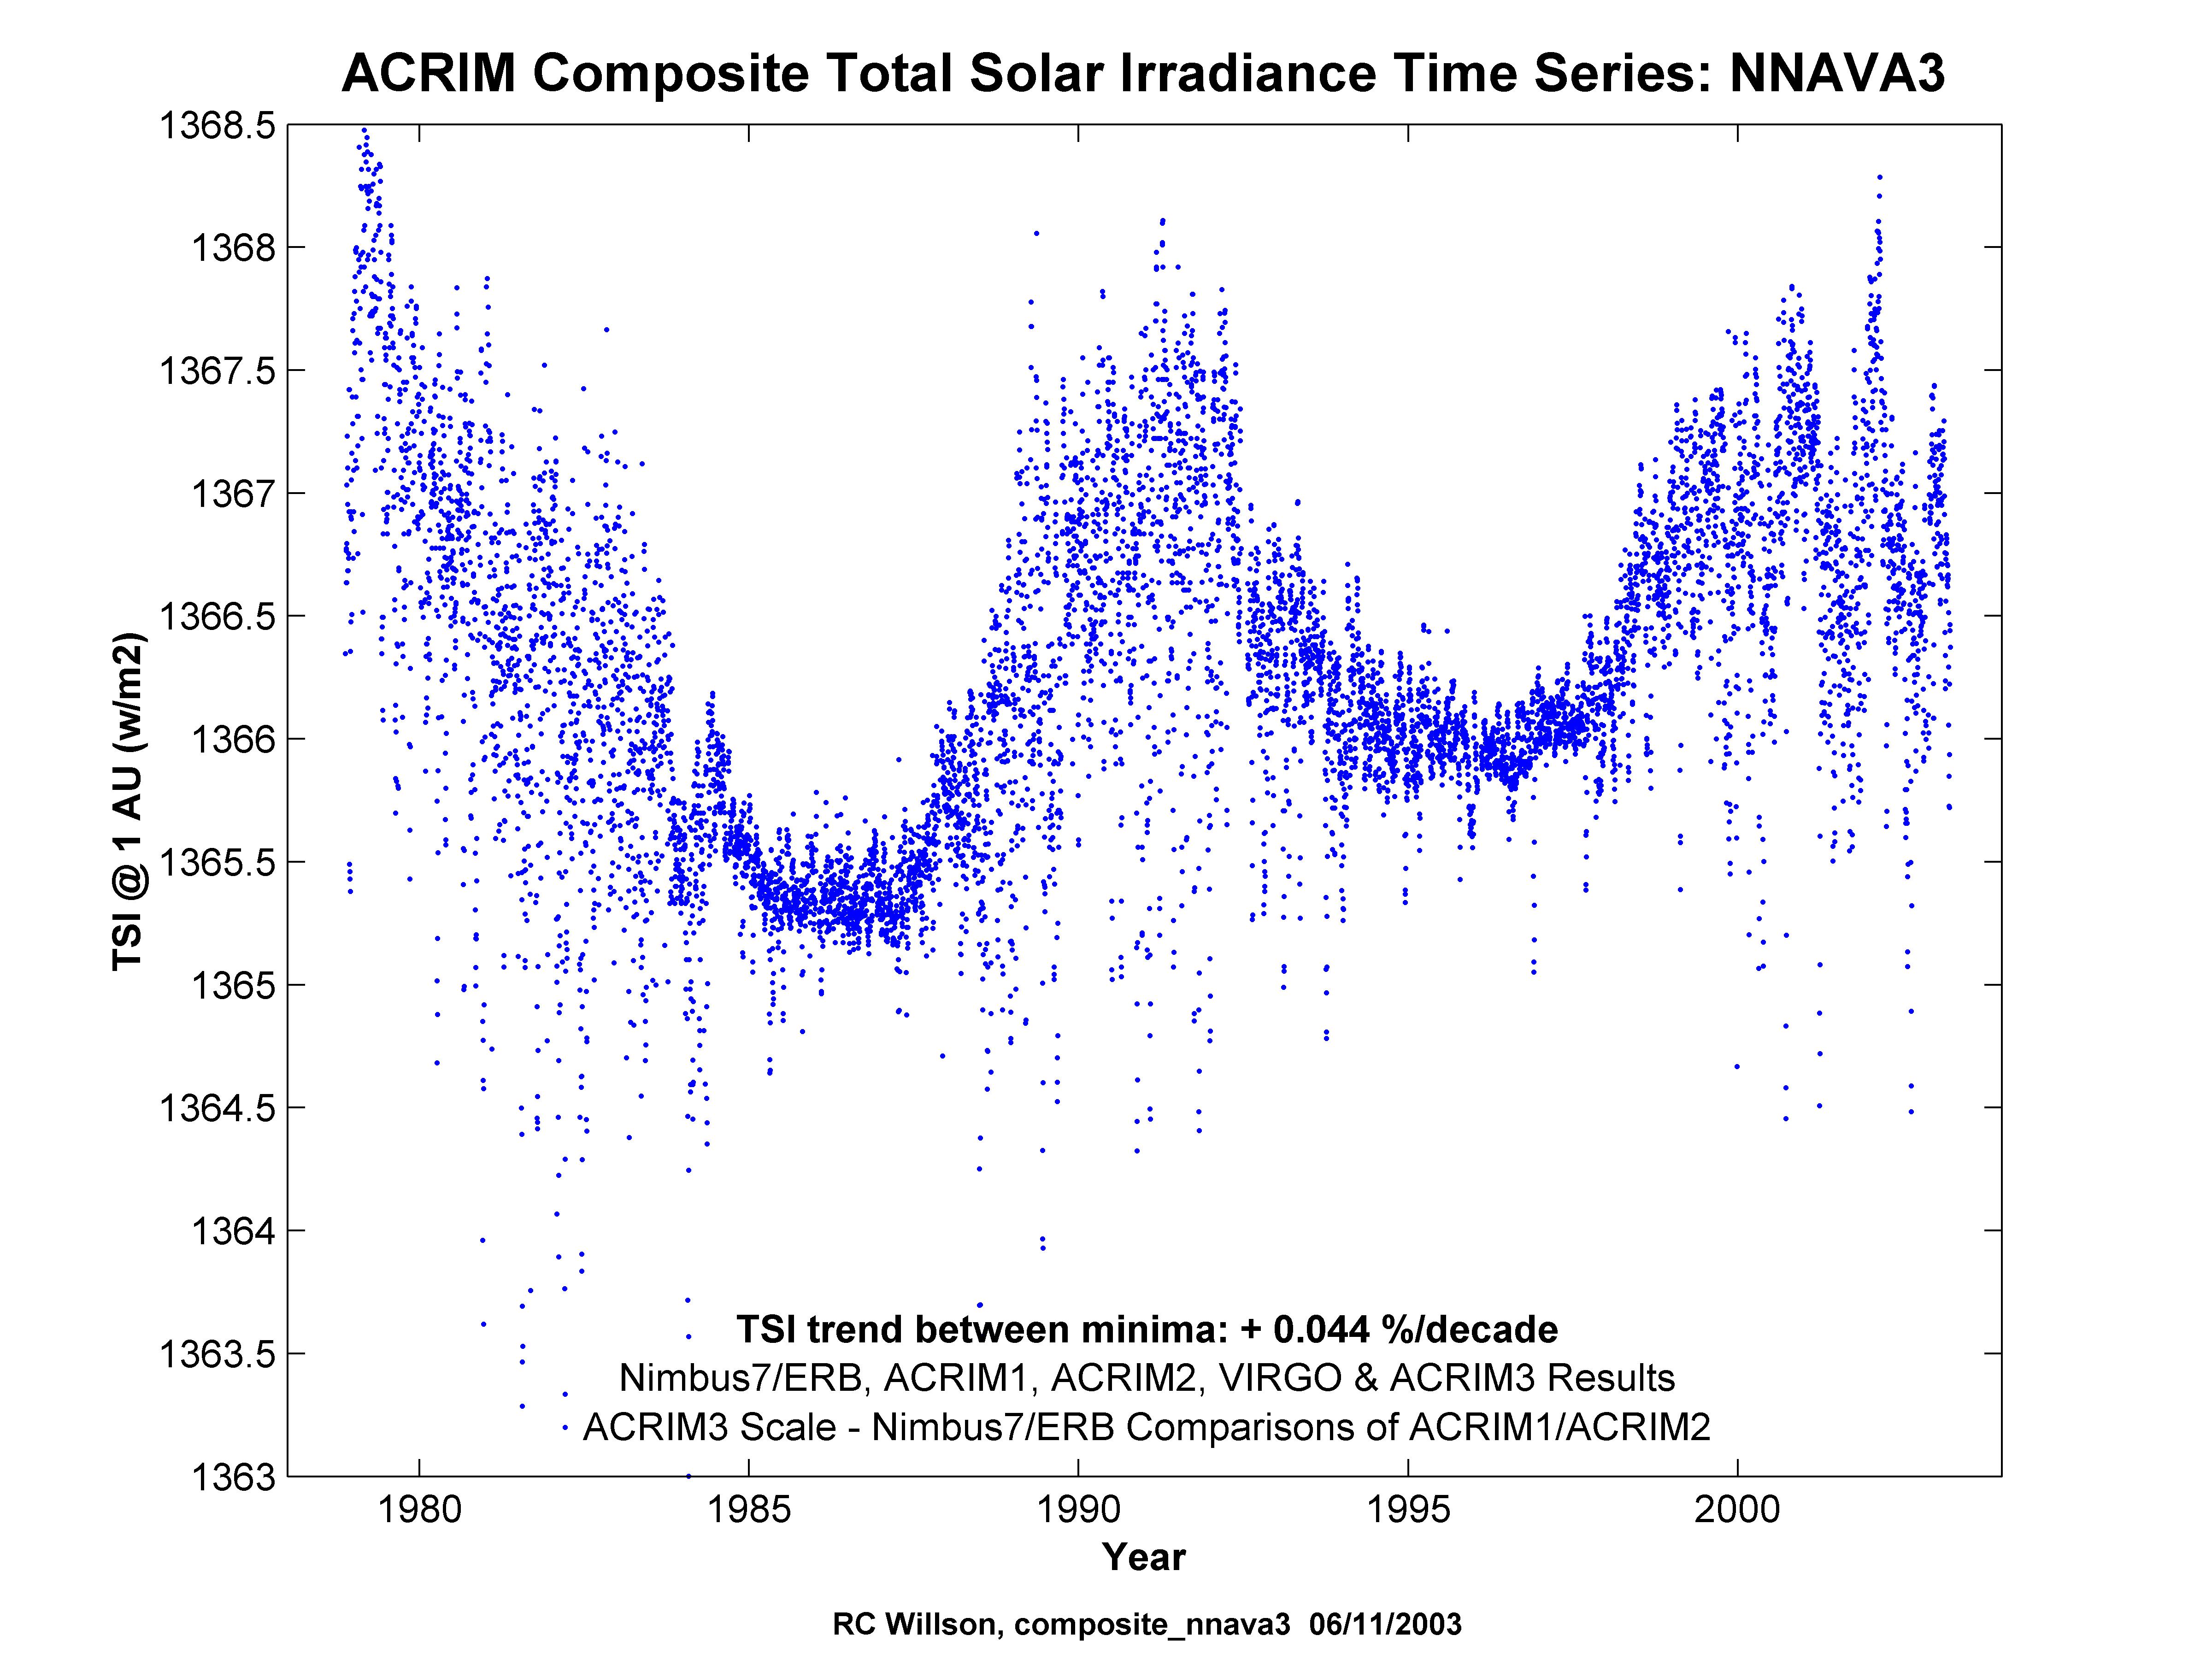
- NNAA3 uses Nimbus7 ERB and ACRIM1, 2, and 3 results (plot)
- NNAVA3 replaces the 1996-1998 ACRIM2 results with the two year VIRGO results (plot)
TSI Data from Individual Satellites
NASA Earth Radiation Budget Satellite (ERBS) Data Description (October 1984-August 2003)
From 1984 to 2003, total solar irradiance (TSI) values were obtained from the solar monitor on the Earth Radiation Budget Satellite (ERBS) non-scanner instrument. The ERBS solar monitor is an active cavity radiometer, similar in design to the Active Cavity Radiometer Irradiance Monitors (ACRIM) which have flown on the NASA Solar Maximum Mission (SMM), Upper Atmosphere Research Satellite (UARS), and Atmospheric Laboratory for Applications and Science (ATLAS) spacecraft missions. The ERBS satellite was placed into orbit on October 5, 1984, and the solar monitor is still operating properly, after almost 18 years. The measurement precision is about 0.01 percent, while the accuracy is 0.2 percent. At least once every 14 days, the Sun is observed by the monitor. The averaged irradiance values represent an almost instantaneous level, and not a daily average.
NASA NIMBUS Satellite Data Data Description (November 16,1978 to December 13,1993 )
From 1978 to 1993, Total Solar Irradiance (TSI) values were obtained from the solar monitor on the NASA NIMBUS (named for the latin word for raincloud) non-scanner instrument. The NIMBUS solar monitor is an active cavity radiometer, similar in design to the Active Cavity Radiometer Irradiance Monitors (ACRIM) which have flown on the NASA Solar Maximum Mission (SMM), Upper Atmosphere Research Satellite (UARS), and Atmospheric Laboratory for Applications and Science (ATLAS) spacecraft missions. The paper "The Nimbus-7 Solar Total Irradiance: A new Algorithm for its Deviation" by D.V. Hoyt, H.L. Kyle, J.R. Hickey, and R.H. Maschoff (JGR, vol 97, pp 51-63) describes the methodology used to reduce the data.
NIMBUS satellite Biweekly database in x-y plottable format.
NOAA 9 and 10 Satellite Data Description (January 23, 1985 - December 20, 1989)
From 1985 to 1989, total solar irradiance (TSI) values were obtained from the solar monitor on the NOAA9 and NOAA 10 nonscanner instruments. The NOAA solar monitor is an active cavity radiometer, similar in design to the Active Cavity Radiometer Irradiance Monitors (ACRIM) which have flown on the NASA Solar Maximum Mission (SMM), Upper Atmosphere Research Satellite (UARS), and Atmospheric Laboratory for Applications and Science (ATLAS) spacecraft missions.
NASA Solar Maximum Mission (SMM) Satellite Data Description (February 16, 1980 - June 1, 1989)
From 1980 to 1989, TSI values were obtained from the solar monitor on the SMM non-scanner instruments. The SMM solar monitor is an active cavity radiometer, similar in design to the Active Cavity Radiometer Irradiance Monitors (ACRIM) which have flown on the NASA Solar Maximum Mission (SMM), Upper Atmosphere Research Satellite (UARS), and Atmospheric Laboratory for Applications and Science (ATLAS) spacecraft missions.
SOHO VIRGO, v2 Satellite Data Description (February 16, 1980 - June 1,1989)
From 1980 to 1989, TSI values were obtained from the solar monitor on the SMM non-scanner instruments. The SMM solar monitor is an active cavity radiometer, similar in design to the Active Cavity Radiometer Irradiance Monitors (ACRIM) which have flown on the NASA Solar Maximum Mission (SMM), Upper Atmosphere Research Satellite (UARS), and Atmospheric Laboratory for Applications and Science (ATLAS) spacecraft missions.
NASA UARS ACRIM II TSI Satellite Data Description (October 4, 1991 - December 31,1997)
The second Active Cavity Radiometer Irradiance Monitor experiment (ACRIM II) was launched in September 1991 as part of the science payload of the Upper Atmosphere Research Satellite (UARS). The variations on solar rotational and active region time scales are clearly seen. The large, short-term decreases are caused by the TSI blocking effect of sunspots in magnetically active regions as they rotate through our view from Earth. The peaks of TSI preceding and following these sunspot "dips" are caused by the faculae of solar active regions whose larger areal extent causes them to be seen first as the region rotates on our side of the sun and last as they rotate over the opposite solar limb. The downward trend through the 1991-1997 period is similar in slope and amplitude to that observed by ACRIM I during the declining phase of solar cycle 21. From the peak of solar cycle 21 to its minimum, the TSI decreased by about 0.08 percent. It appears likely from the ACRIM II results thus far that the cycle 22-23 minimum in TSI will occur during 1997, near the average solar cycle period of about 11 years after the cycle 21-22 minimum, and with a similar decrease relative to the maximum of cycle 22 in the 1990-1991 period.
Older Databases
This is a Dr. John C. Arvesen dataset.
NASA research aircraft database
Results are presented of an experiment to determine extraterrestrial solar spectral irradiance at Earth's mean solar distance within the 300-2500 nm wavelength region. Spectroradiometric measurements were performed during eleven research flights on board a NASA CV-990 aircraft at altitudes between 11.6 km and 12.5 km. Precision of the measurements was better than +/- 1 percent. Absolute accuracy of the resultant extraterrestrial solar spectral irradiance is about +/-3 percent over most of the measurement range. A listing of results is presented at intervals varying from 0.1 nm throughout most of the uv-visible Fraunhofer region to 5 nm in the continuum region of the infrared. Additionally, a listing of solar spectral irradiance, smoothed over the detailed Fraunhofer structure, is presented for engineering use.
Charles Greeley Abbot Solar Constant Database Data Description (1902-1954)
The Smithsonian Astrophysical Observatory (APO) gathered solar constant data during at least 49 years of solar monitoring. The solar constant is the total amount of energy received from the sun per unit time per unit area exposed normally to the Sun's rays at the average Sun-Earth distance and outside of Earth's atmosphere. The purpose of this APO project was to determine an accurate value for this energy flux and to determine whether or not the Sun's total energy output is indeed constant in time.
Notwithstanding all of the shortcomings and controversy inherent in the data, this program is the longest and most carefully conducted solar radiation program in the 20th century. Dr. Vernon Derr estimated that to fully understand and correct the database, the research efforts of two qualified scientists studying the data for approximately two years would be needed. The 47 data files are available via the link above.