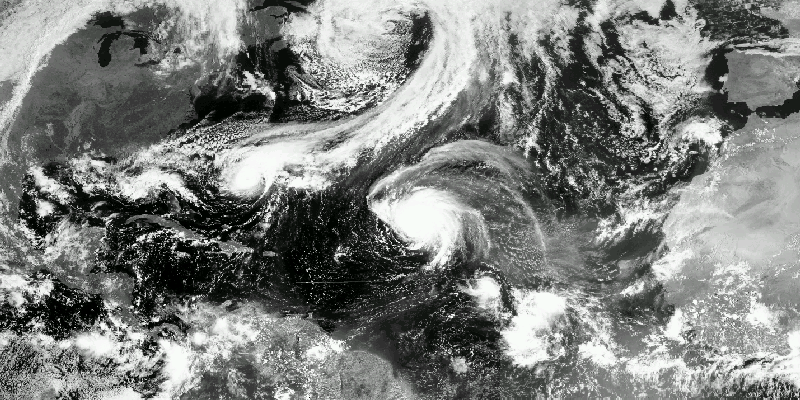
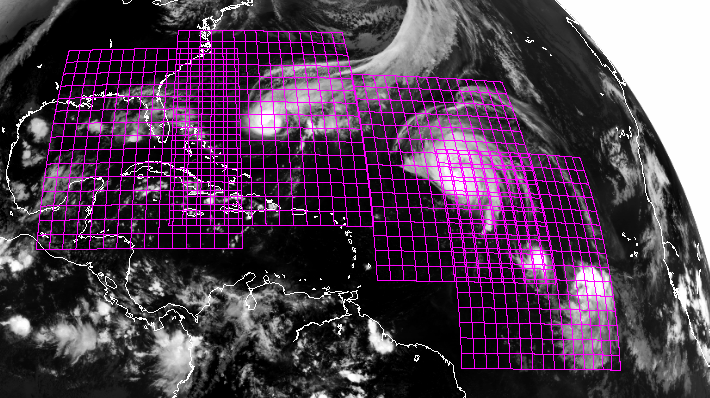
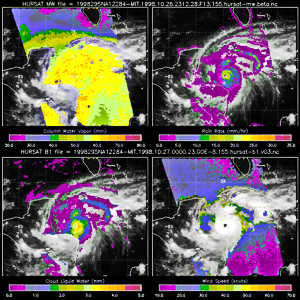
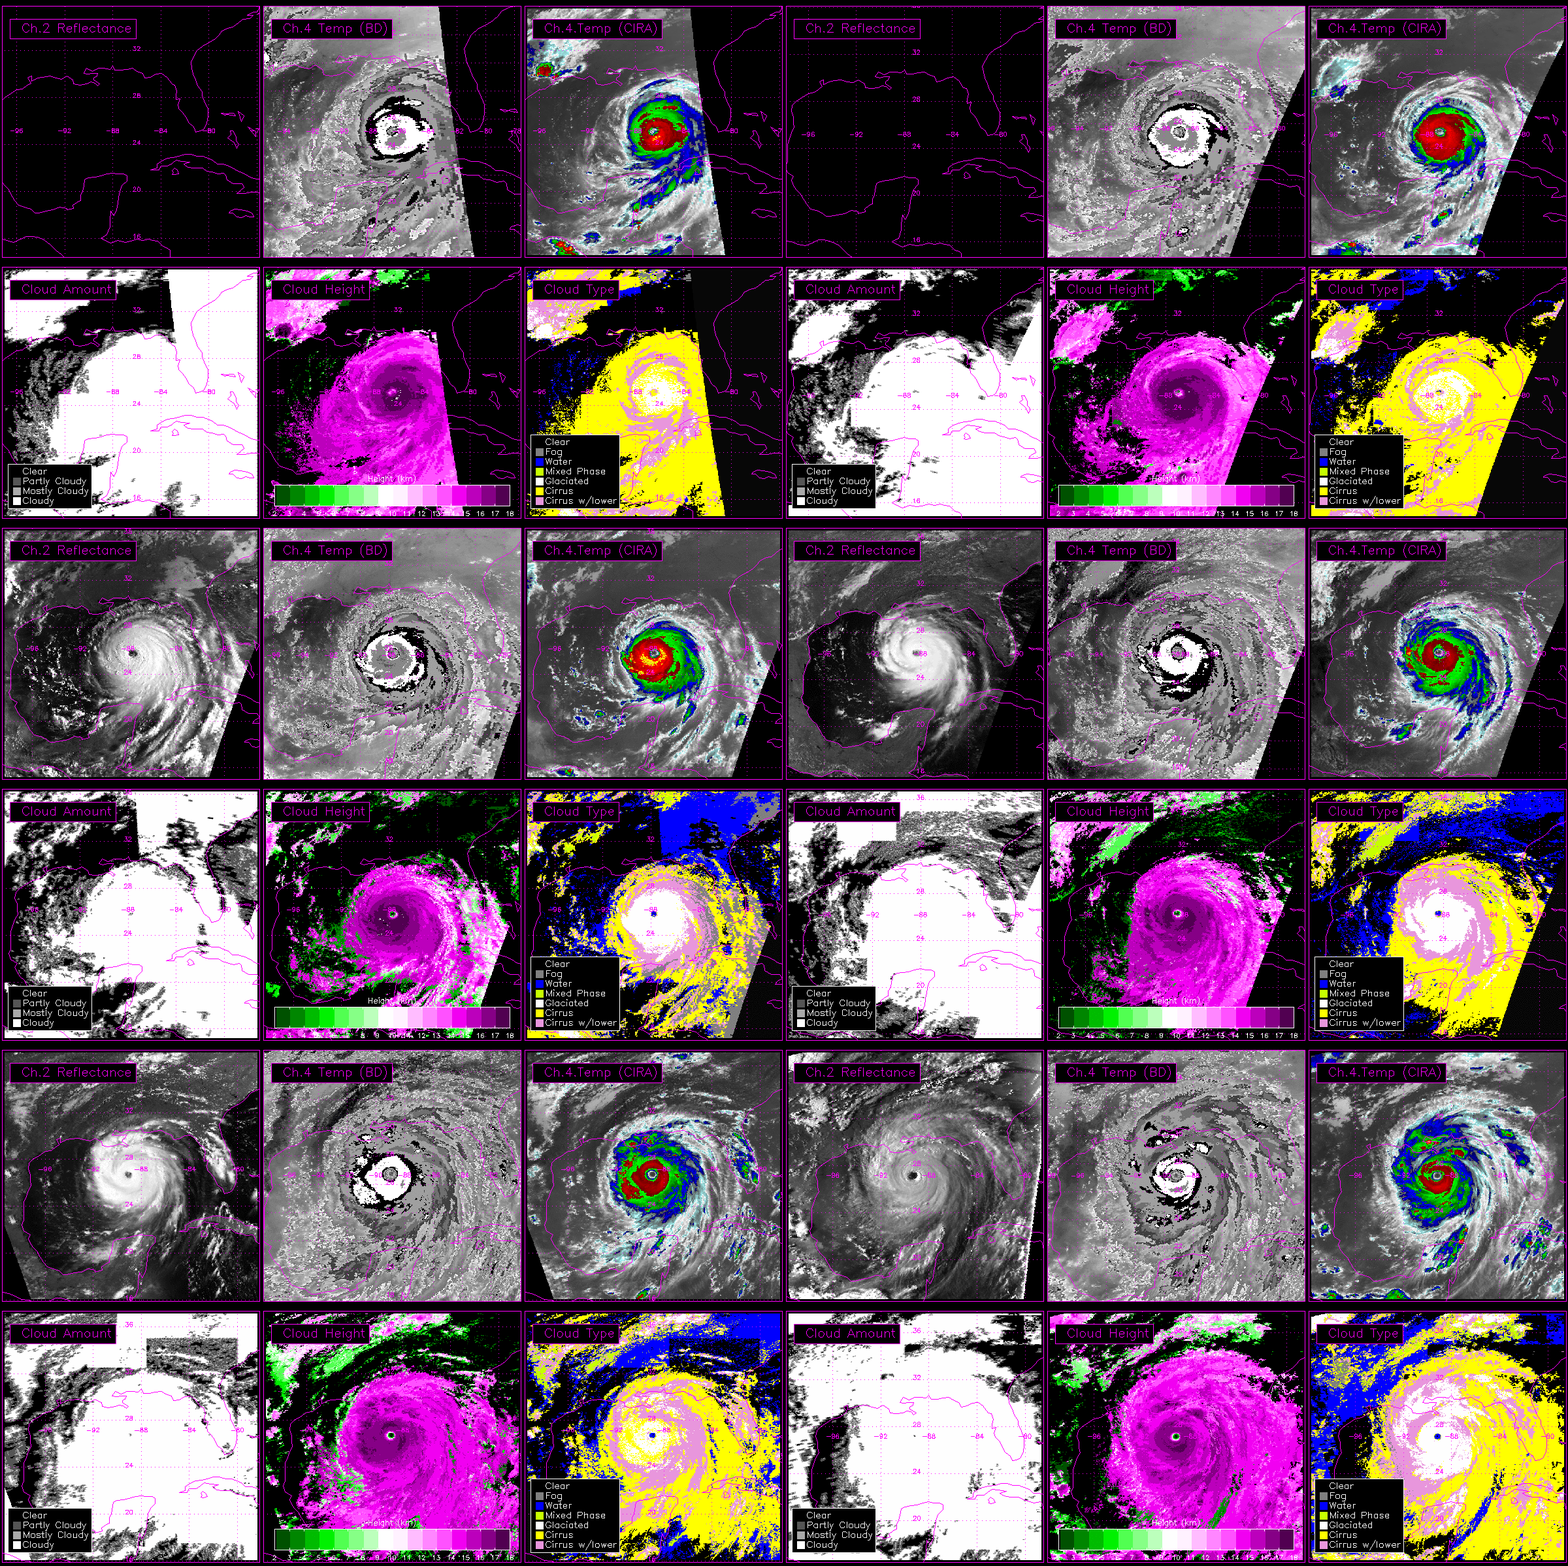
The HURSAT project provides Tropical Cyclone-centric satellite data in gridded netCDF format to create a database of small, portable, and easy to work with storm data. The project began with HURSAT-B1, but has expanded to include data from other satellite sources with different temporal and spatial resolution.

About
HURSAT-B1 data are derived from International Satellite Cloud Climatology Project (ISCCP) B1 data. The HURSAT-B1 v06 data spans 1978-2015 and provides coverage of global tropical cyclones at 8-km and 3-hourly resolution.
More Information

HURSAT-B1 data are freely available via FTP and HTTPS. Please let us know when and how you use the data so that we can notify you of dataset updates and justify future revisions. Feel free contact us with questions, concerns, or comments about the dataset.
Email: ncei.sat.info@noaa.gov
Current Version
HURSAT-B1 v06
HURSAT Version 6 includes:
- Data through 2015 for B1 (geostationary)
- ARCHER parameters (an objective algorithm to identify cyclone center and eye characteristics)
Data Access
Data is grouped by individual storm in the following formats:
Data Revision Notification
Please notify us when you download HURSAT data so we can contact you when newer dataset versions become available.
Citation
When using this data for research, please reference Knapp and Kossin, 2007:
Knapp, K. R. and J. P. Kossin, 2007: New global tropical cyclone data from ISCCP B1 geostationary satellite observations. Journal of Applied Remote Sensing, 1, 013505.
doi:10.1117/1.2712816
Access Methods
The data are in netCDF format. Access methods include:
- Libraries available for Fortran, C and other programming languages
- Commercial software have netCDF libraries "built-in", such as MatLab and IDL
- ArcGIS version 9.2 allows GIS users to analyze the data
This dataset consists of raw satellite observations derived from the ISCCP B1 data centered on historical tropical cyclones (TC).
| HURSAT Version 6 Details and Specifications | |
|---|---|
| Updates | Updated annually. See revisions for more information. |
| Temporal coverage | 1978–2015 |
| Temporal resolution | 3 hourly imagery |
| Spatial coverage | Global coverage: all storms are visible from the geostationary constellation (except some early storms in the Indian Ocean) |
| Spatial resolution | ~8km |
| Data set grid | 0.07 deg lat/lon grid centered on the storm location at the time of image with 301x301 pixels (spans ~1100km from the storm center) |
| Spectral coverage | Visible (~0.6um) and infrared window (~11um) and other channels when available: water vapor (~6.7 um), near IR (~3.9 um) and split window (~12 um) |
| Satellites |
|
| Formats | |
| Dataset generation | IBTrACS were temporally interpolated to match the 3-hourly satellite resolution. The satellite data were then gridded to 8km, with grid centers fixed on the tropical cyclone center of circulation. |
| Dataset details | Knapp and Kossin, 2007 |
Calibration
ISCCP data were tested to determine the long-term stability of infrared observations. This was performed by comparing geostationary-based observations with HIRS footprints. See Knapp (2008) for the details of the calibration.
Version 6 (Current Version)
Release Date
Jan 2018
Features
Generated with IBTrACS v03r09
Bugs
None reported
Version 5
Release Date
May 2011
Features
- Generated with IBTrACS v03r02
- Each storm file also has entire storm track and intensity data from IBTrACS
- Consistent file naming with HURSAT AVHRR v05 and HURSAT MW v05.
Bugs
None reported
Version 4
Not publicly released (Dec 2009)
Version 3
Release Date
1 December 2007
Features
- Version 2.0 bugs fixed.
- New storm name format will not change as data are updated.
- No storm tracks from JTWC East Pacific are used.
- Better QC instituted to remove corrupt files.
- More thorough merging of HURDAT and JTWC storm tracks. Changes to best track files were documented online.
- Files were made smaller by replacing the VZA array with a scalar value of view zenith angle for each file.
Bugs
- This doesn’t affect the data itself, only the filenames.
Version 2
Release Date
30 June 2007
Features
- Version 1.0 bugs fixed.
- Storm location, central pressure and maximum sustained wind provided as variables.
- netCDF metadata provides traceability by providing original JTWC/HURDAT filenames for each netCDF file.
- Filename changed from hursat-geo to hursat-b1
Bugs
- Two storms had inverted temperature scales (1982WP027 and 1982WP028)
- Some storms were inadvertently included (sometimes called invests)
- Incorrect temporal interpolation when original best track data was not 6-hourly
Version 1
Bugs
- Data not fully CF compliant
- View zenith angle (VZA) grid calculated incorrectly - although the VZA value in the filename is correct.
- Some positions were interpolated incorrectly from 6-hourly to 3-hourly (for instance, the last 8 interpolated positions for Ophelia in 2005)
Papers that use this data include:
- Kossin, J. P., and M. Sitkowski, 2009: An Objective Model for Identifying Secondary Eyewall Formation in Hurricanes. Monthly Weather Review, 137, 876-892. doi:10.1175/2008MWR2701.1
- Elsner, J. B., Kossin, J. P., Jagger, T. H., 2008: The increasing intensity of the strongest tropical cyclones. Nature, 455, 92-95. doi:10.1038/nature07234
- Knaff, J. A., Cram, T. A., Schumacher, A. B., Kossin, J. P., DeMaria, M., 2008: Objective identification of annular hurricanes. Weather and Forecasting, 23, 17-28. doi:10.1175/2007WAF2007031.1
- Kossin, J. P., D. J. Vimont, K. R. Knapp, and R. J. Murnane, 2006: A Reanalysis of Global Hurricane Trends, Geophy. Res. Lett., 34, L04815. doi:10.1029/2006GL028836
About
Passive microwave observations provide significant information content because most clouds are transparent at microwave wavelengths. The HURSAT-Microwave (MW) dataset is constructed using a very similar process to HURSAT-B1. Each time a Defense Meteorological Satellite Program (DMSP) satellite passes over a tropical cyclone, Special Sensing Microwave Imager (SSMI) data are mapped to an equal angle grid (fixed latitude/longitude) centered on the temporally interpolated storm location. HURSAT-MW provides brightness temperatures for all seven SSMI channels. No product retrievals (e.g., rain rate, total column water vapor, etc.) are provided in the data but are possible (e.g., viewing the imagery derived from the data).

Current Version: HURSAT-MW v05
Other Satellites
Currently, HURSAT-MW data is limited to DMSP SSMI data. If you are interested in hurricane imagery from other microwave satellites, please contact us.
Data Access
Data Revision Notification
Please let us know when and how you use HURSAT data so that we can notify you of dataset updates and justify future revisions.
Citation
No official citation is available for HURSAT-MW. Its development closely follows Knapp and Kossin, 2007, so please cite that paper and note that you are using HURSAT-MW-v05 in any subsequent work.
Access Methods
The data are provided in NetCDF format. Access methods include:
- Libraries available for Fortran, C, and other programming languages
- Commercial software have netCDF libraries "built-in," such as MatLab and IDL
- ArcGIS version 9.2 allows GIS users to analyze the data
HURSAT-MW consists of raw satellite observations derived from the SSMI Sensor Data Records (SDR) data centered on historical tropical cyclones (TC).
| Current Version: HURSAT MV v05 and Specifications | |
|---|---|
| Updates | Updated as needed. See revision plans for more information. |
| Number of storms | 2412 tropical cyclones |
| Number of storm observations | 58,284 netCDF files (Average of 24 observations per storm) |
| Temporal coverage | July 10, 1987 to Dec. 14, 2009 |
| Temporal resolution | Dependent on number of operational SSMI |
| Spatial coverage | Global coverage |
| Basins | All tropical cyclone-prone basins in the world |
| Spatial resolutions | Data are provided in two forms: gridded and swath.
|
| Dataset grid | Data from within ~1100 km of the interpolated storm center are provided. The gridded data are provided at 0.07 deg lat/lon grid centered on the storm location at the time of image on a 301x301 grid. |
| Spectral coverage |
|
| Satellites | F8, F10, F11, F13, F14, F15 |
| Format |
|
| Dataset generation | IBTrACS v03r02 were used to locate potential SSMI overflights. When SSMI was nearby, the 6-hourly storm track was interpolated to a position coincident with the SSMI observation. The satellite data were then interpolated to 8km. NetCDF files also contain the swath data at the native satellite resolution. |
Version 5 (Current Version)
Release Date
1 Jul 2012
Features
Files consistently named with other HURSAT v05 types (B1 and AVHRR).
Bugs
None known yet
Versions 2–4 (Skipped)
These versions were never produced. Instead, the version numbering was skipped to be consistent with HURSAT-B1
Version 1
Released
Summer 2009
Beta
Released
1 Feb 2008
Features
SSMI data centered on tropical cyclones at native resolution as well as gridded (CF compliant).
Bugs
None known yet
About
HURSAT-AVHRR is derived from NOAA's Advanced Very High Resolution Radiometer and balances the weaknesses of the HURSAT-B1 data. It has higher (4km) spatial resolution, and its observations originate from one instrument instead of a variety of instruments in the B1 record. However, the temporal resolution is limited to two to eight observations per day, depending on the satellite configuration.

HURSAT-AVHRR v05 (Current Version)
Data Access
Data Revision Notification
Please let us know when and how you use HURSAT data so that we can notify you of dataset updates and justify future revisions.
Citation
No official citation is available for HURSAT-AVHRR. Its development closely follows Knapp and Kossin, 2007, so please cite that paper and note that you are using HURSAT-AVHRR-v05 in any subsequent work.
Access Methods
The data are provided in NetCDF format. Access methods include:
- Libraries available for Fortran, C, and other programming languages
- Commercial software have netCDF libraries "built-in,” such as MatLab and IDL
- ArcGIS version 9.2 allows GIS users to analyze the data
HURSAT-AVHRR data consist of raw satellite observations derived from the AVHRR Level 1B Global Area Coverage (GAC) data centered on historical tropical cyclones (TC).
| Current Dataset: Version 5 | |
|---|---|
| Updates | To be updated as needed. See revision plans for more information. |
| Number of storms | 3,350 tropical cyclones |
| Number of storm observations | 130,386 netCDF files (Average of 39 observations per storm) |
| Temporal coverage | Nov. 5, 1978 to Dec. 15, 2009 |
| Temporal resolution | Dependent on number of operational NOAA satellites |
| Spatial coverage | Global coverage |
| Basins | All tropical cyclone-prone basins in the world |
| Spatial resolutions | Data are interpolated to a 4km fixed grid |
| Dataset grid | Data from within ~1,100 km of the interpolated storm center are provided. The gridded data are provided at 0.035 deg lat/lon grid centered on the storm location at the time of image on a 601x601 grid. |
| Spectral coverage | All AVHRR channels are provided in the HURSAT files |
| Satellites | NOAA-5 through 18 and METOP-2 |
| Format |
|
| Dataset generation | IBTrACS v03r02 were used to locate potential AVHRR overflights. When AVHRR was nearby, the 6-hourly storm track was interpolated to a position coincident with the AVHRR observation. The satellite data were then interpolated to 4km. NetCDF files also contain the swath data at the native satellite resolution. |
Version 5
Released
1 Jul 2012
Features
Files consistently named with other HURSAT v05 types (B1 and MW).
Bugs
None known yet
Version 3 and 4 (Skipped)
These versions were never produced. Instead, the version numbering was skipped to be consistent with HURSAT-B1
Version 2
Released - 2010
Version 1
Released - 2008
Beta
Released - 2007


