


Use the marine microplastics interactive map to view, filter, and download marine microplastics from the NCEI archive. Contact the NCEI user services (ncei.info@noaa.gov) with questions.
Data Usage Disclaimer: Microplastics vary in origin, density, chemical properties, morphology, size and color. There is currently no single combination of methods for sampling, extracting, analyzing, and reporting, which means that microplastic concentrations in the database may not always be comparable across studies. Review the archive metadata for more details about the data records (such as sampling protocols and instrumental analysis) before using the data.
How do I download marine microplastics data?
- Use the Filters panel to input coordinates, dates, locations, etc.
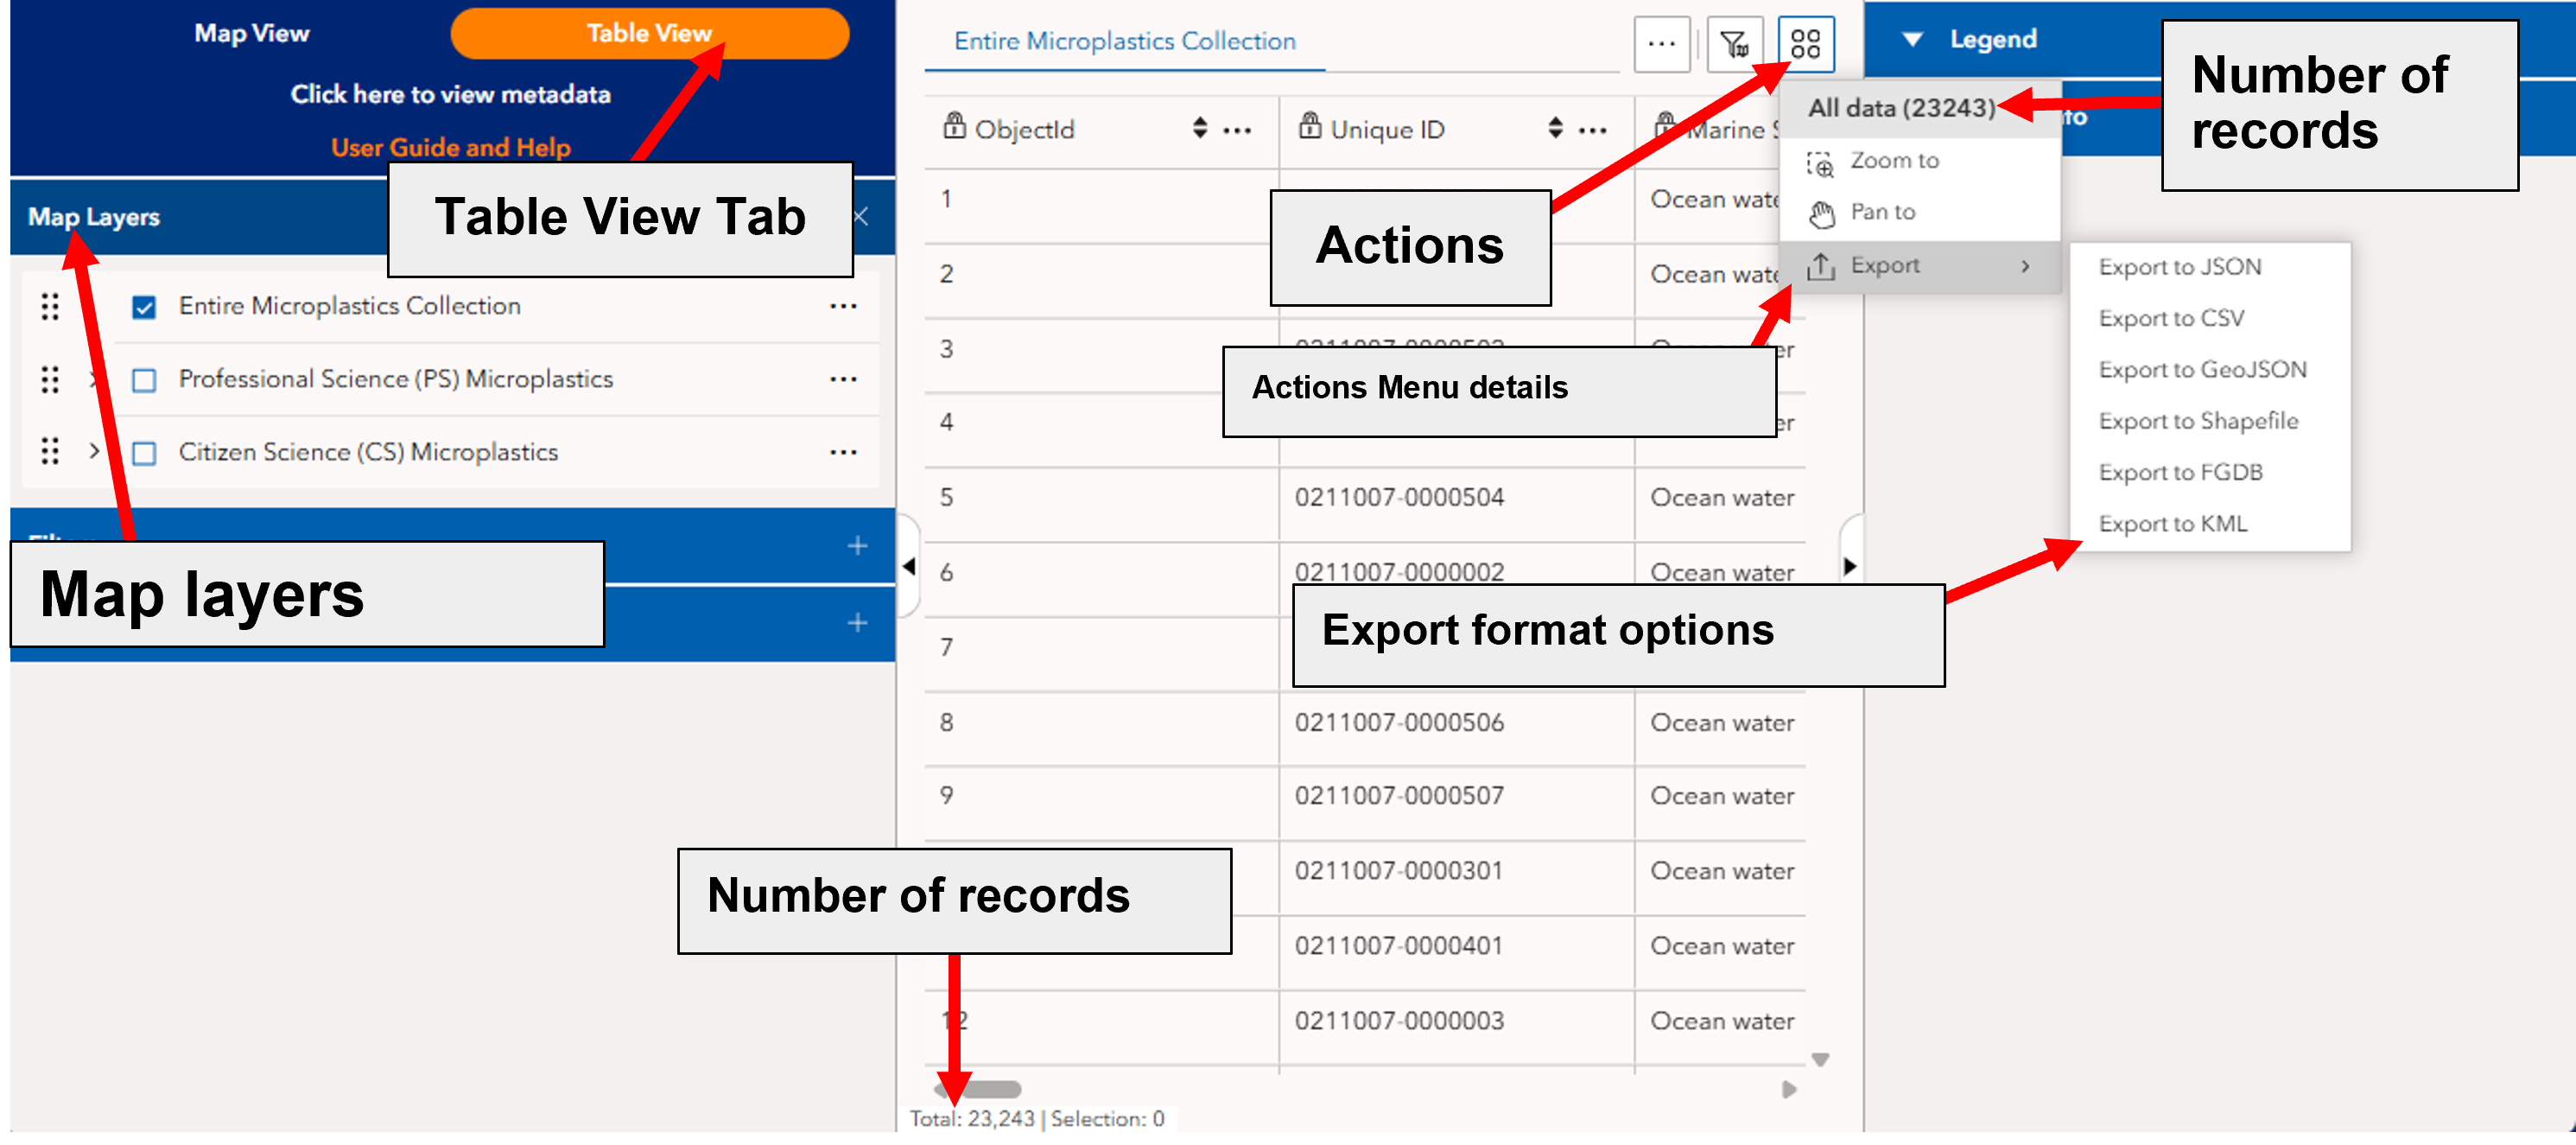
- Select the Table View tab to show the data records.
- If the Professional and/or Citizen Science layers are active, choose a Marine Setting tab.
- Use the Show/hide columns button to choose which variables to include in your results (optional).
- From the Actions menu, choose "All data", then "Export".
- Choose an export format (e.g., JSON, CSV, GeoJSON).

- Use the selection tool to draw a rectangle (default), lasso/polygon, circle, line, or point.
- Choose a selection mode (partially or completely within (default) or completely contained by) in the selection tool (optional).
- Click, hold, and drag your mouse or keypad to draw your chosen shape.
- Switch to Table View tab to display the data records.
- If the Professional and/or Citizen Science layers are active, choose a Marine Setting tab.
- Use the Show/hide columns button to customize specific data columns/record information (optional).
- Use the "Show selection" button (
 ) to show the selected data records in the table (optional).
 - From the Actions menu, choose "Selected", then "Export".
- Choose an export format (e.g., JSON, CSV, GeoJSON).

- The entire collection of the Marine Microplastics Database is available for download.
- If data has been filtered, click the Reset filters button
 at the bottom of the Filter panel to clear all filters and return to default settings. Otherwise, skip this step and start at step 3 below.
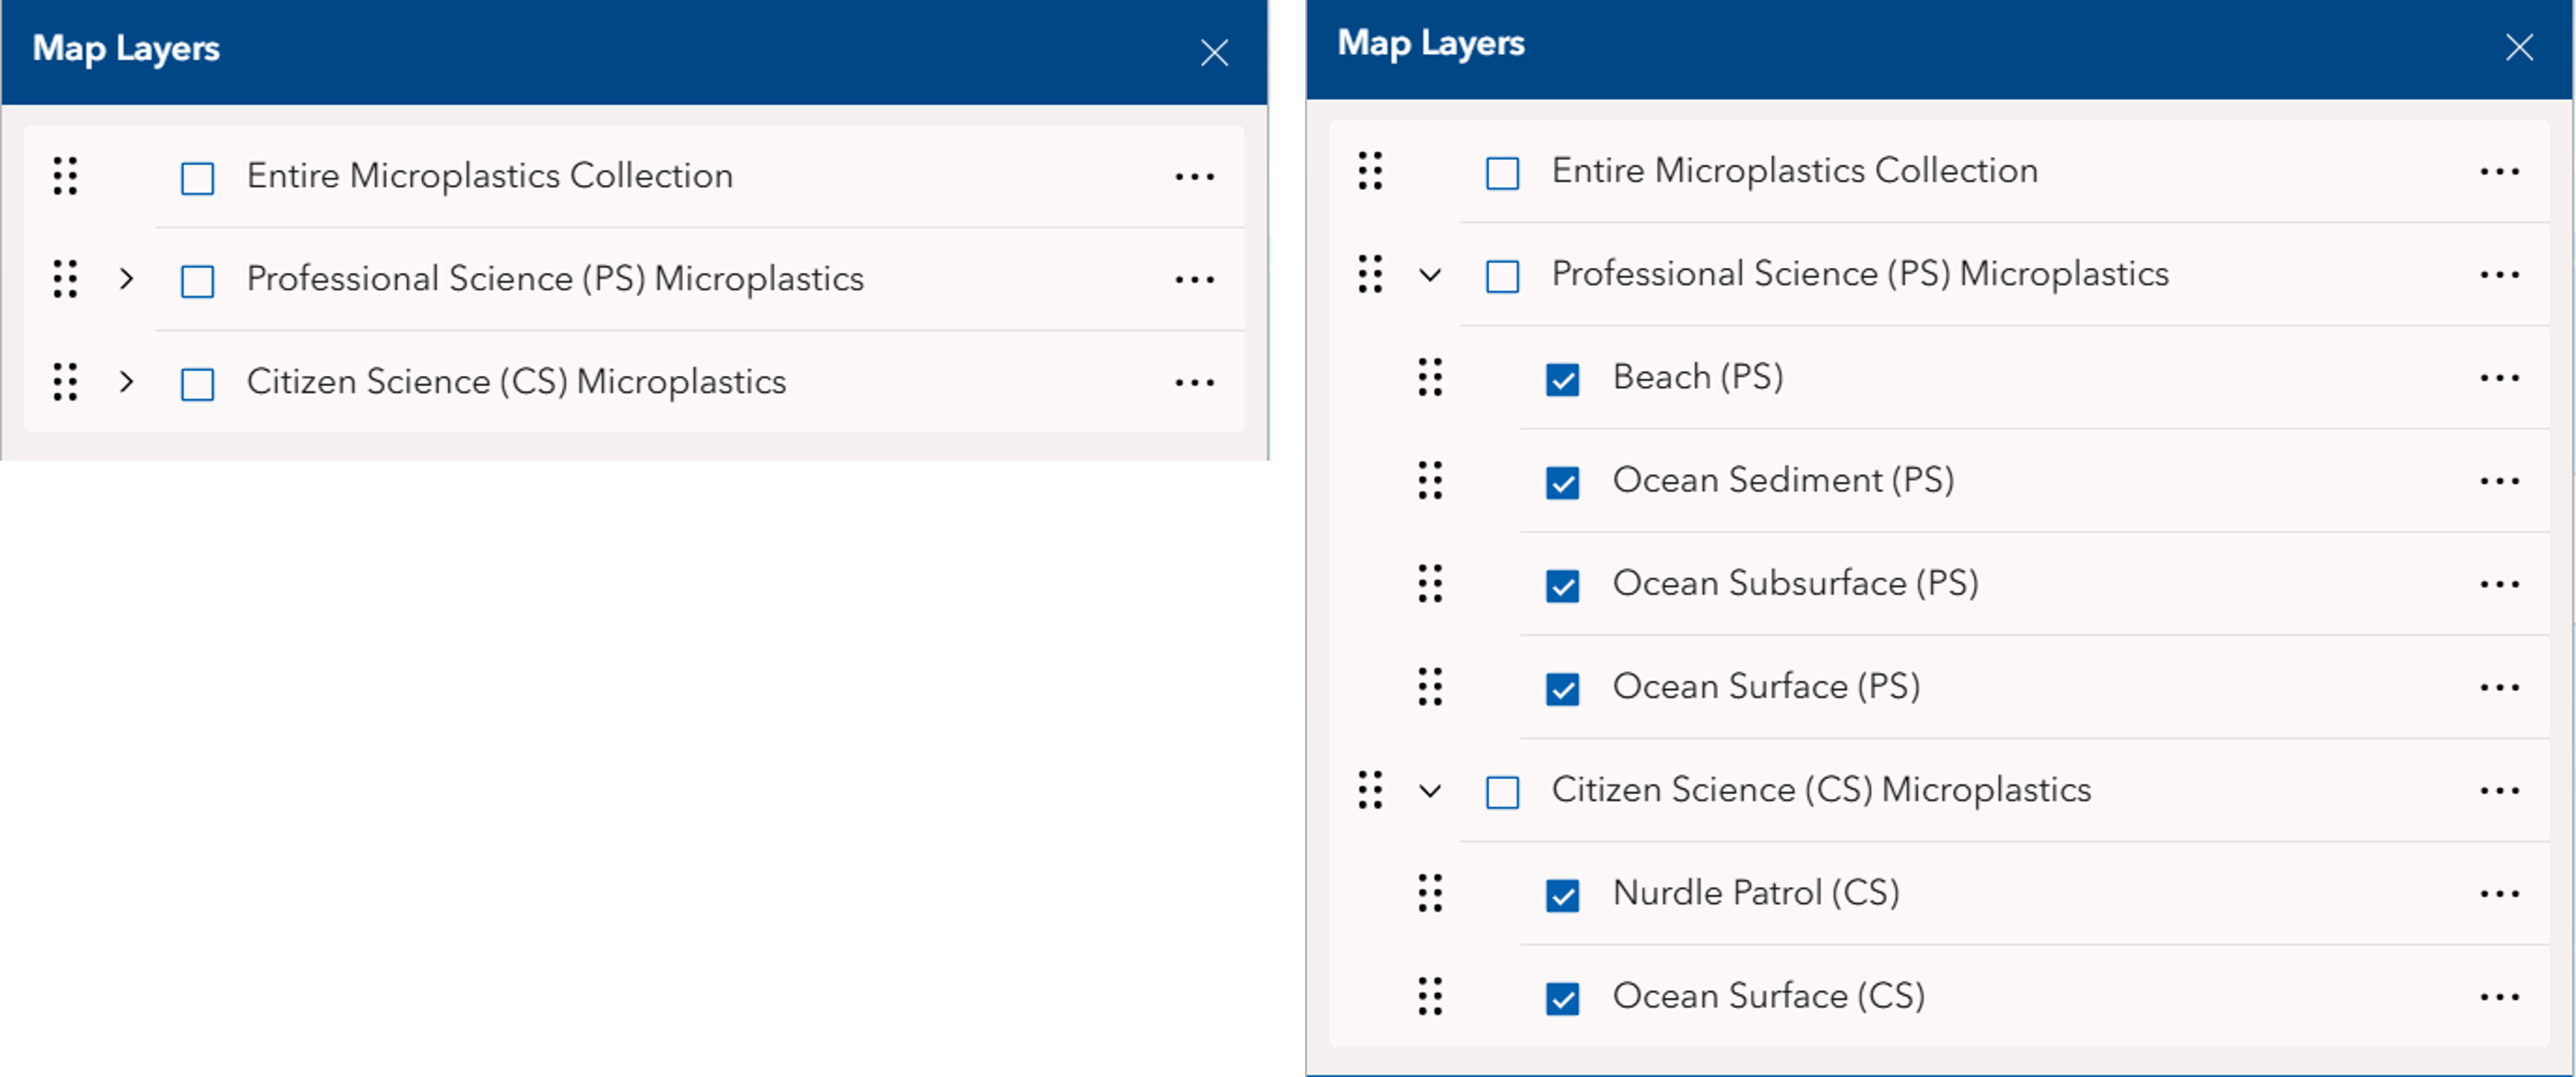
 - Select the Entire Microplastics Collection map layer.
- Select the Table View tab to show the data records in the right panel, and make sure the Entire Microplastics Collection tab is selected.
- The number of records in the entire database is displayed in the Actions menu.
- Use the Show/hide columns button to customize specific data columns/record information, if needed.
- From the Actions menu, choose "All data", then "Export".
- Choose the desired format to export the data.
- A popup warning, “Are you sure you want to export all data records? Exporting this large dataset will take time”, is displayed.
- Click Export to export the entire data records
Metadata and Citation Information
Before using downloaded data, please review the dataset metadata, which provides information on data sources, sampling methods, processing procedures, quality-control practices, and citation requirements.
Metadata can be accessed by pressing "Click here to view metadata" at the top of the map portal.
How do I use the Marine Microplastics interactive map and data portal?
When the interactive map viewer is first opened, no map layers and filters are applied, and no microplastic concentration data is displayed. Only the basemap is visible (Figure 4).

Choose a data layer to display data on the map. The map shows an icon/symbol that corresponds with each record in the database. You can use additional filters to narrow the search and make it easier to navigate different data points.
Interactive Map Features
Map layers display different data types or categories, and make it easier to search for a specific record.
Entire Microplastics Collection Layer
The Entire Microplastics Collection layer contains all microplastic concentration records currently available in the Marine Microplastics Database, regardless of data source.
Professional Science (PS) Microplastics Layer
Professional Science (PS) microplastics concentration records are collected by professional scientists through academic, government, monitoring, or research programs. The four professional science layers are:
- Beach (PS)
- Ocean Sediment (PS)
- Ocean Subsurface (PS)
- Ocean Surface (PS)
The Professional Science (PS) Microplastics checkbox must be checked for these layers to be active for display.
Citizen Science (CS) Microplastics Layer
Citizen Science (CS) microplastics concentration records are collected by trained volunteers, community monitoring groups, educational programs, and ship crews participating in citizen science initiatives. The two citizen science layers are:
- Nurdle Patrol (CS)
- Ocean Surface (CS)
The Citizen Science (CS) Microplastics checkbox must be checked for these layers to be active for display.
Professional Science and Citizen Science data go through the same quality-control procedures before being incorporated into the archive database. Professional Science datasets often contain more comprehensive metadata and may be more spatially and temporally consistent spatial and temporal coverage, while Citizen Science datasets contribute valuable observations from regions and periods that may otherwise be under-sampled.
Each point on the map represents a location where at least one microplastic concentration measurement was recorded. A record contains information on the number of microplastic particles observed within a sampled environmental medium (e.g., ocean surface water, subsurface water, beach sediment, or seafloor sediment). Reported units vary depending on the sampling environment and methodology used.
A single location may contain multiple records collected at different times or sampling conditions.
Each microplastic concentration classification has a corresponding symbol with a different color, shape, and size.
How do I understand the symbols on the map?
Use the Legend panel, located on the right-hand side of the map, for explanations of each color, symbol, and concentration category. Each layer has it's own legend.


The legend explains the meaning of each icon on the map. The icon shape (circle, triangle, star, square, asterisk) shows it's marine setting, the size and color gradient indicate its concentration threshold (larger and darker=higher concentration, smaller and lighter=lower concentration).
What are marine settings?
In the database, microplastic concentration records are grouped into five marine environments or “settings”:
- Beach
- Nurdle Patrol
- Ocean Sediment
- Ocean Surface
- Ocean Subsurface
These marine settings represent different sampling environments and collection methods. Each setting has different concentration units and classification ranges because microplastic concentrations are measured differently in different environments.
For example, ocean water concentrations report the number of particles per cubic meter of water, while ocean sediment concentrations measure the number of particles per kilogram of dry sediment. Nurdle Patrol observations are based on standardized beach surveys and report the number of nurdles collected during a 10-minute survey.
What are concentration thresholds?
The marine microplastics database groups measurements into concentration classes ranging from Very Low to Very High. Each marine setting has specific thresholds that determine where a sample ranks on the scale. These thresholds are based on the current data, and may change as new data are added.
Professional Science (PS) Classifications
Citizen Science (CS)
The Feature Info panel, located below the Legend panel on the right-hand side of the map, provides detailed metadata and attribute information of one selected record displayed on the map. If no specific record is manually selected initially, information of the first record (i.e. “1 of N” in the selected feature indicator) is displayed where N is the total number of records displayed on the map.
To display feature information of a different record, click the left or right arrow button adjacent to this selected feature indicator or click a data point on the map directly. Each selected feature is highlighted in cyan on the map.
The Actions Menu in this panel provides zoom to, pan to, show on map, view in table, add marker and export capabilities for the currently selected feature. A subset of these functions is also available for the rest of the displayed data points.

You can also click a location on the interactive map to view detailed information of the records at that location in a pop-up window.
The specific information displayed may vary depending on the marine setting, sampling method, and data source. For example, some fields are applicable only to ocean-water samples, while others apply only to sediment, beach, or Nurdle Patrol observations.
|
Parameter |
Definition |
|---|---|
|
ObjectId |
Internal database identifier for the record. |
|
Unique ID |
Unique identifier assigned to the record. |
|
Marine Setting |
Environmental setting in which the sample was collected (e.g., Ocean water, Ocean sediment, Beach, Nurdle Patrol). |
|
Sample Date |
Date on which the sample was collected. Date format: Month-Day-Year |
|
Latitude (degree) |
Latitude of the sampling location in decimal degrees. |
|
Longitude (degree) |
Longitude of the sampling location in decimal degrees. |
|
Sampling Method |
Method used to collect the sample. |
|
Mesh Size (mm) |
Mesh size of the sampling equipment or filter, in millimeters. |
|
Microplastics Measurement |
Measured microplastic concentration. Unit described in "Unit". |
|
Unit |
Unit associated with the microplastic measurement. |
|
Concentration Class |
Five distinct concentration classes (Very Low, Low, Medium, High, Very High) of microplastic measurement of a particular medium/environment. Classification is based on data in this database only. Classification and class range is different for each data type (i.e., ocean water, ocean sediment, beach, Nurdle Patrol). |
|
Concentration Class Range |
Numerical concentration range associated with the classification category. |
|
Ocean |
Ocean basin in which the sample was collected. |
|
Region |
Marine region (major sea) associated with the sampling location. |
|
Subregion |
Marine subregion associated with the sampling location. |
|
Country |
Country associated with the sampling location, where applicable. |
|
State |
State, province, or administrative region associated with the sampling location, where applicable. |
|
Keywords |
Keywords associated with the dataset. |
|
Short Reference |
Abbreviated citation associated with the data source. |
|
Long Reference |
Full citation associated with the data source. |
|
Organization |
Organization responsible for collecting or providing the data. |
|
DOI |
Digital Object Identifier associated with the source dataset or publication. |
|
NCEI Accession Number |
NOAA NCEI archive accession number for the dataset. |
|
NCEI Accession Link |
Link to the archived dataset in NCEI archives. |
|
Ocean Bottom Depth (m) |
Bottom depth of ocean at the sampling location, in meters. |
|
Water Sample Depth (m) |
Depth within water where the sample was collected, in meters. |
|
Sediment Sample Depth (m) |
Depth within the sediment where the sample was collected, in meters. |
|
Beach Location |
Name or description of the beach sampling location. |
|
Transect Number |
Transect identifier used during beach sampling. |
|
Sampling Point on Beach |
Sampling point identifier within a beach transect. |
|
Volunteers Number |
Number of volunteers participating in a Nurdle Patrol survey. |
|
Collecting Time (min) |
Duration of a Nurdle Patrol survey, in minutes. |
The interactive map includes several tools and information displays that support navigation, data exploration, and record selection.
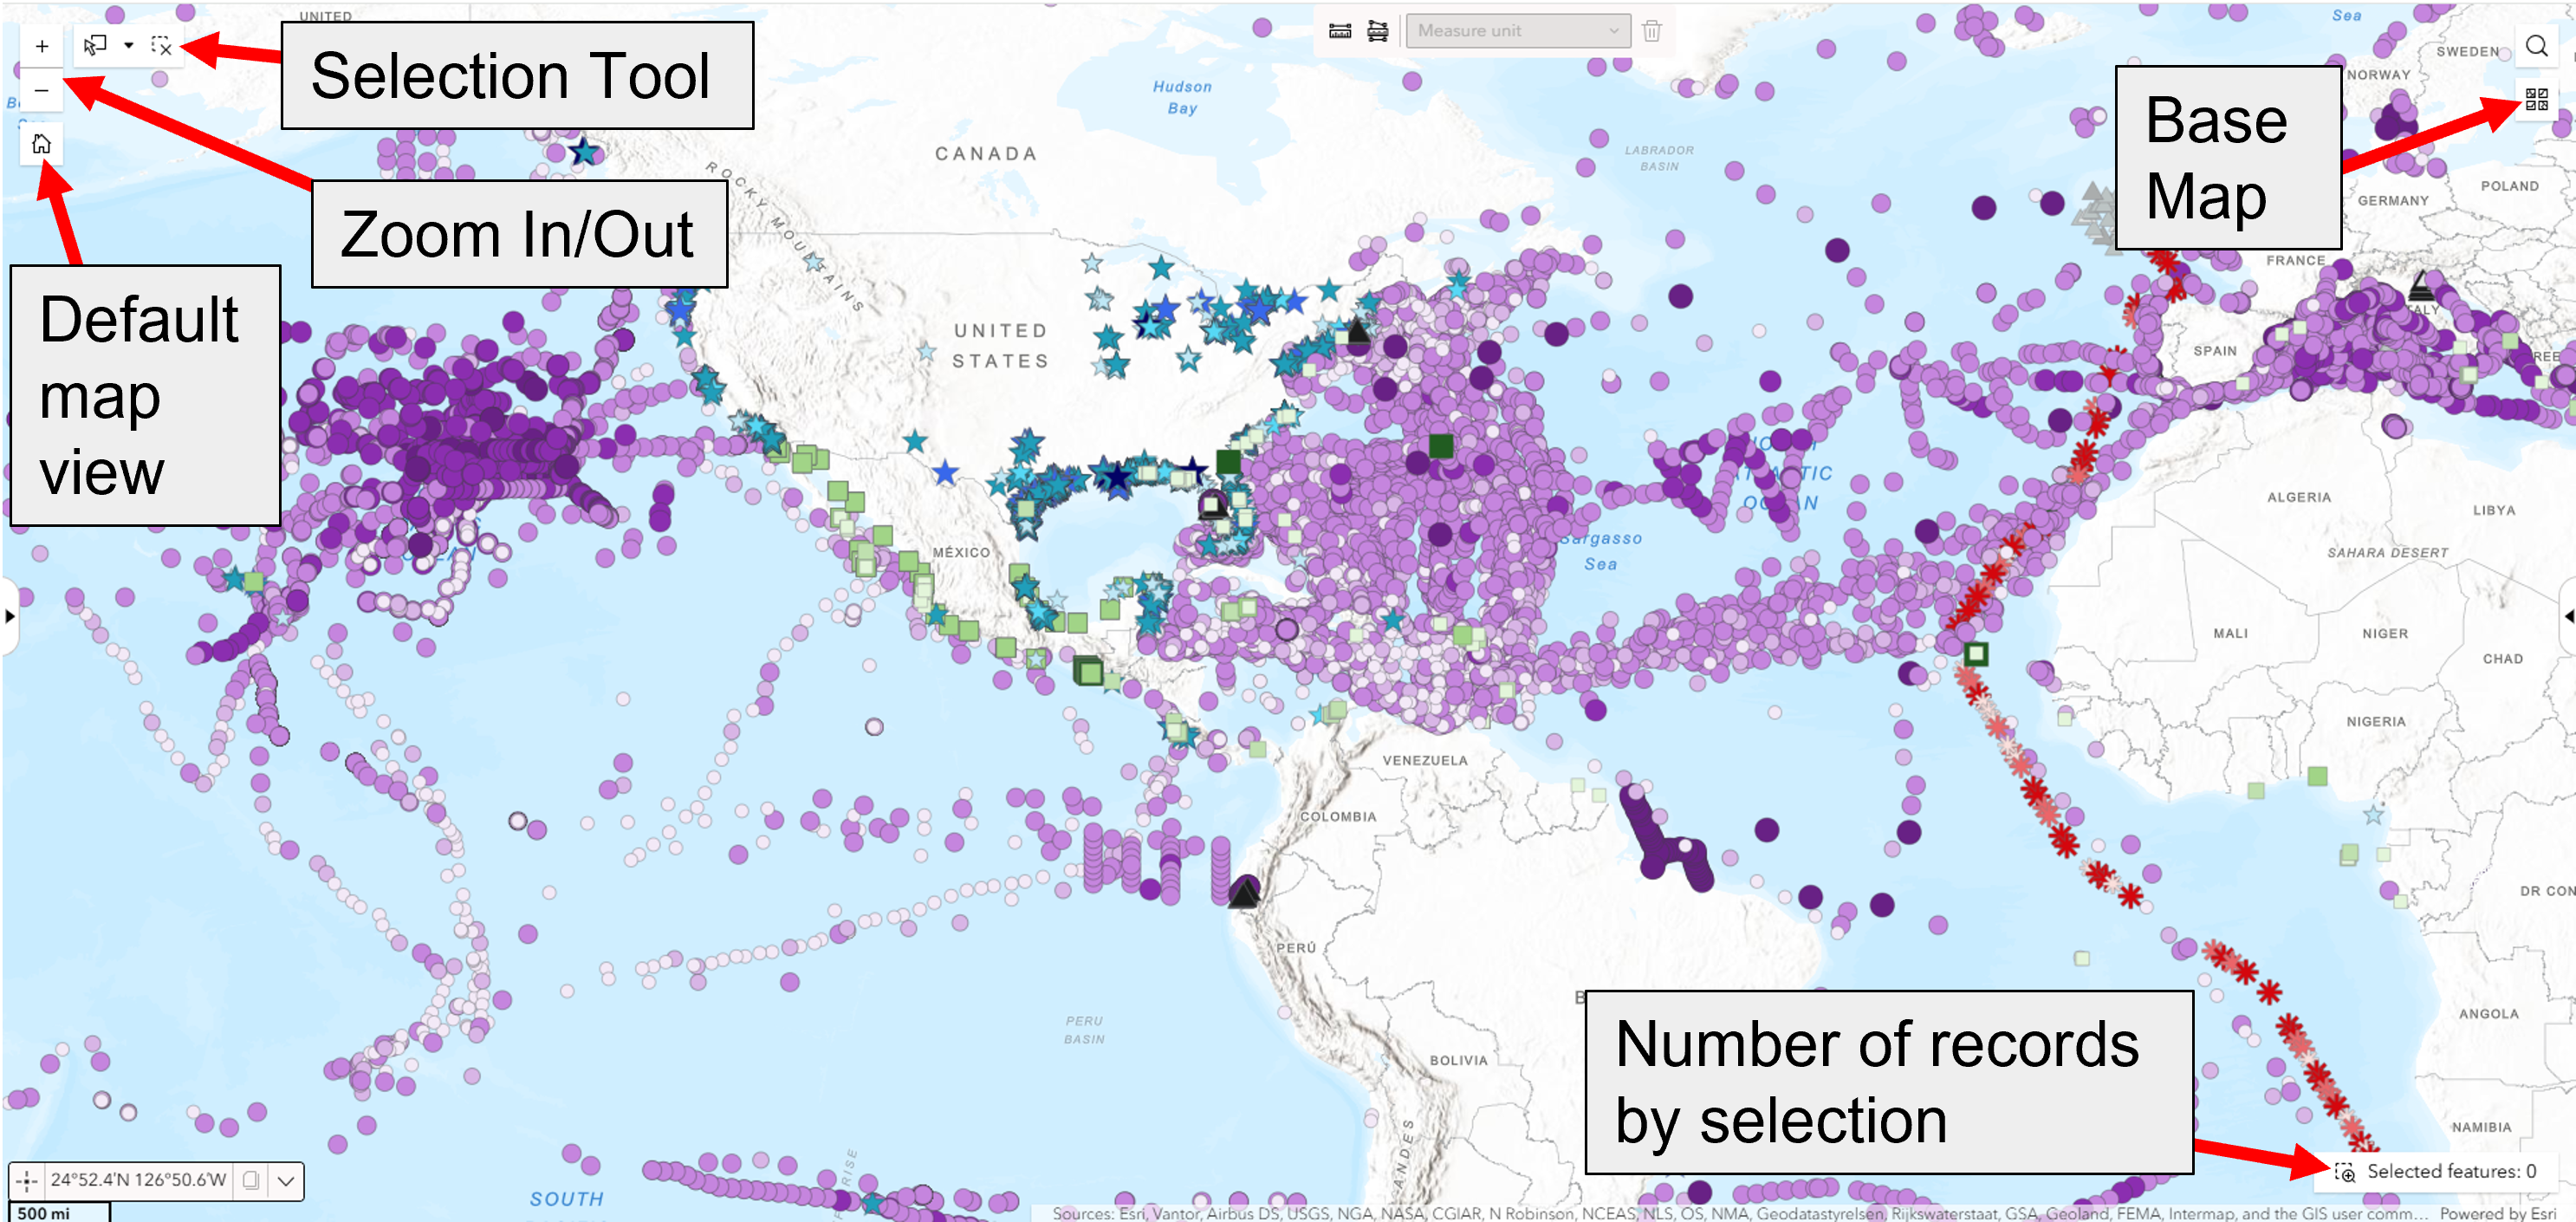
Selection Tool
Use the selection tool to identify and highlight records in an area of interest. Choose a specific point, or draw a rectangle, circle, line, or polygon to select all the records between or within the area you are interested in. All the records in your selection can be viewed, summarized, or exported for further analysis.
Basemap
The basemap provides geographic context for the displayed microplastic records. Different basemap styles may be available depending on the selected map settings.
Zoom Controls
Use the Zoom In (+) and Zoom Out (-) buttons to adjust the map scale and examine records at different spatial resolutions.
Pan and Navigate
Click and drag the map to move to a different geographic region. The map can be centered on any area of interest without affecting the displayed records.
Selected Features Counter
The Selected Features counter displays the number of records currently chosen using the map selection tool or a clicked map location.
Filters are located on the left side of the interface, immediately after the the data layers panel. Multiple filters may be applied simultaneously to narrow the displayed records by geographic location, sampling characteristics, concentration measurements, and other metadata attributes.
The interactive map and data table automatically update when filters are applied. The display may take a few moments to update when you filter the full database.
To return to the full dataset, use the reset filters button () in the bottom write corner of the panel to clear the selected filters and restore the default settings.

|
Field |
Description |
|---|---|
|
Dates |
Select a start and end date to display records collected within a specified time period. Format is written in date format of Month-Day-Year. |
|
Latitude Limits |
Enter minimum and maximum latitude values to limit records to a specified geographic range. Example: -47.125 and 30.5 |
|
Longitude Limits |
Enter minimum and maximum longitude values to limit records to a specified geographic range. Example -45.125 and 110.7 |
|
Marine Setting |
Select a marine setting (e.g., Beach, Nurdle Patrol, Ocean sediment or Ocean water). |
|
Ocean |
Click the down arrow to choose a specific ocean from the list provided to limit results to records collected in that ocean. Note that selecting a specific ocean does not automatically subset regions in that ocean. |
|
Region |
Click the down arrow to choose a specific region (major sea) within an ocean from the list provided to limit results to records collected in that major sea. Note that selecting a specific region does not automatically subset oceans in that region. |
|
Concentration Class |
Click the down arrow to choose a specific microplastic concentration class range from the list provided to limit results to records within that class range. The microplastic concentration classes are defined based on the entire microplastic concentration data in the Marine Microplastics Database |
|
Sampling Method |
Click the down arrow to choose a specific sampling method from the list provided to limit results to records that were collected using that sampling method. |
|
Organization |
Click the down arrow to choose a specific organization from the list provided to limit results to records that were collected and provided by that organization. |
|
Study Type |
Limit records to a specific study category represented in the database (Citizen or Professional Science). |
There are two ways to select a record:
1. Select on map
To select a record, click a location on the map. The selected location will be highlighted in cyan, and a popup window will display detailed record information. This method allows only one selected record at a time. If there are multiple matches for a single location, use the left and right arrow buttons on the popup to view each record.

2. Select using the Selection Tool
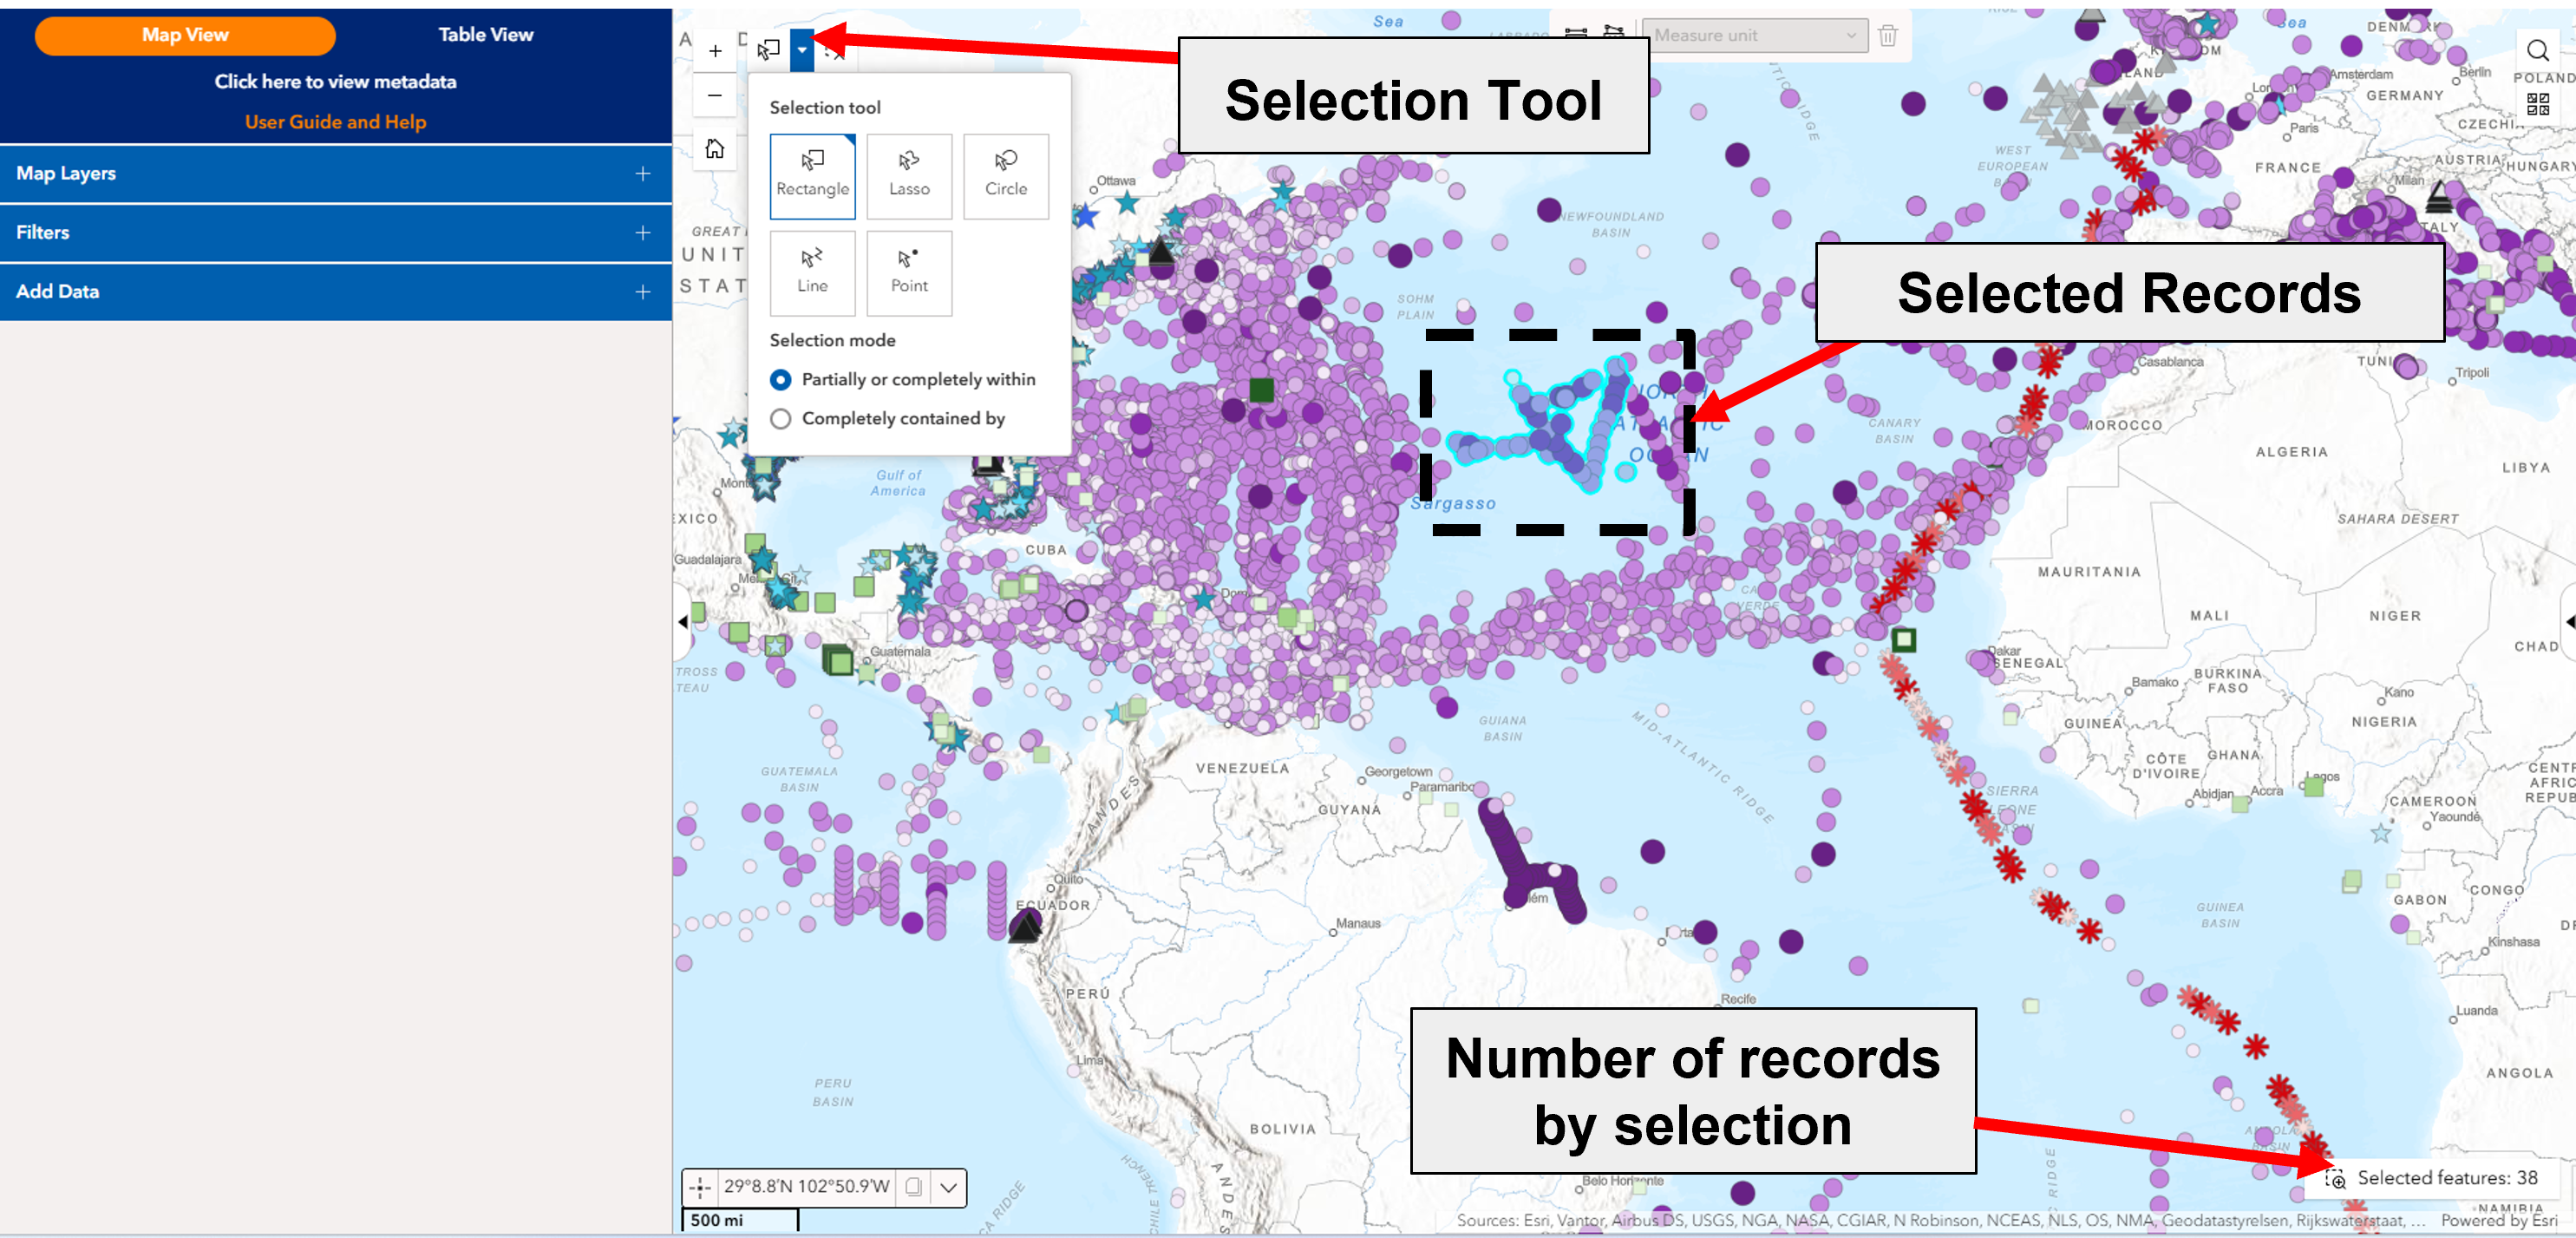
The Selection Tool is located in the map toolbar at the upper-left corner of the map. There are :
- Rectangle: Select records within a rectangular area.
- Lasso: Select records within a custom-drawn polygon.
- Circle: Select records within a circular area.
- Line: Select records intersecting a user-defined line.
- Point: Select records near a specified location.
Two selection modes are provided as spatial filter options to determine the geographical coverage of the resulting records within the area of interest:
- Partially or completely within: Selects records that fall either partially or entirely within the selected area.
- Completely contained by: Selects only records that are entirely contained within the selected area.
To select the database records by a geographic bounding box:
- Click the Selection Tool button or the down arrow to pick a selection method to activate the draw tool. This button turns blue when activated. The rectangle draw tool is selected by default.
- Click, hold, and drag the left mouse button over the map to draw the desired area.
- The selected records in the geographic bounding box are highlighted.
- The number of records in the Selected features button are automatically updated to show the current number of qualifying records in the geographic bounding box with the spatial filter applied. This number will change based on the geographic bounding box selected by the user.
- Click the Selected features button on the bottom right corner of the map to zoom the map into the selected geographic area.
Click the Selection Tool button to deactivate the draw tool. This button returns to white when deactivated.
Selection Tool Mouse Interactions
- Rectangle: Click, hold and drag the left mouse button on the map to define a rectangular area. Release the mouse button when finished.
- Lasso: Click the left mouse button on the map to define each vertex and double-click the last vertex to close the area.
- Circle: Click the left mouse button on the map to define the center of the circle, then drag the mouse to define the radius and release the button to finish the circle.
- Line: Click the left mouse button at the starting point of the line on the map, then double-click at the ending point to finish the line.
- Point: When activated, a dark blue circle with a predefined radius representing the point will appear behind the pointer. Click the left mouse button at the desired location to define the point.
Clear Selection
Click the clear selection icon in the Selection Tool area to remove the selection.
The Table View displays the same data, layers, and filtering options as the interactive map in an interactive table. This display works well with screen readers and other accessibility tools.
Like the map, the table displays the records currently available based on the selected map layers and any active filters. As filters are applied or modified, the table automatically updates to reflect the qualifying records.
The table provides access to record attributes and metadata, allowing records to be sorted, reviewed, and exported for further analysis.
To view records in the table:
- Select map layer(s)
- Apply filters
- Select the table view
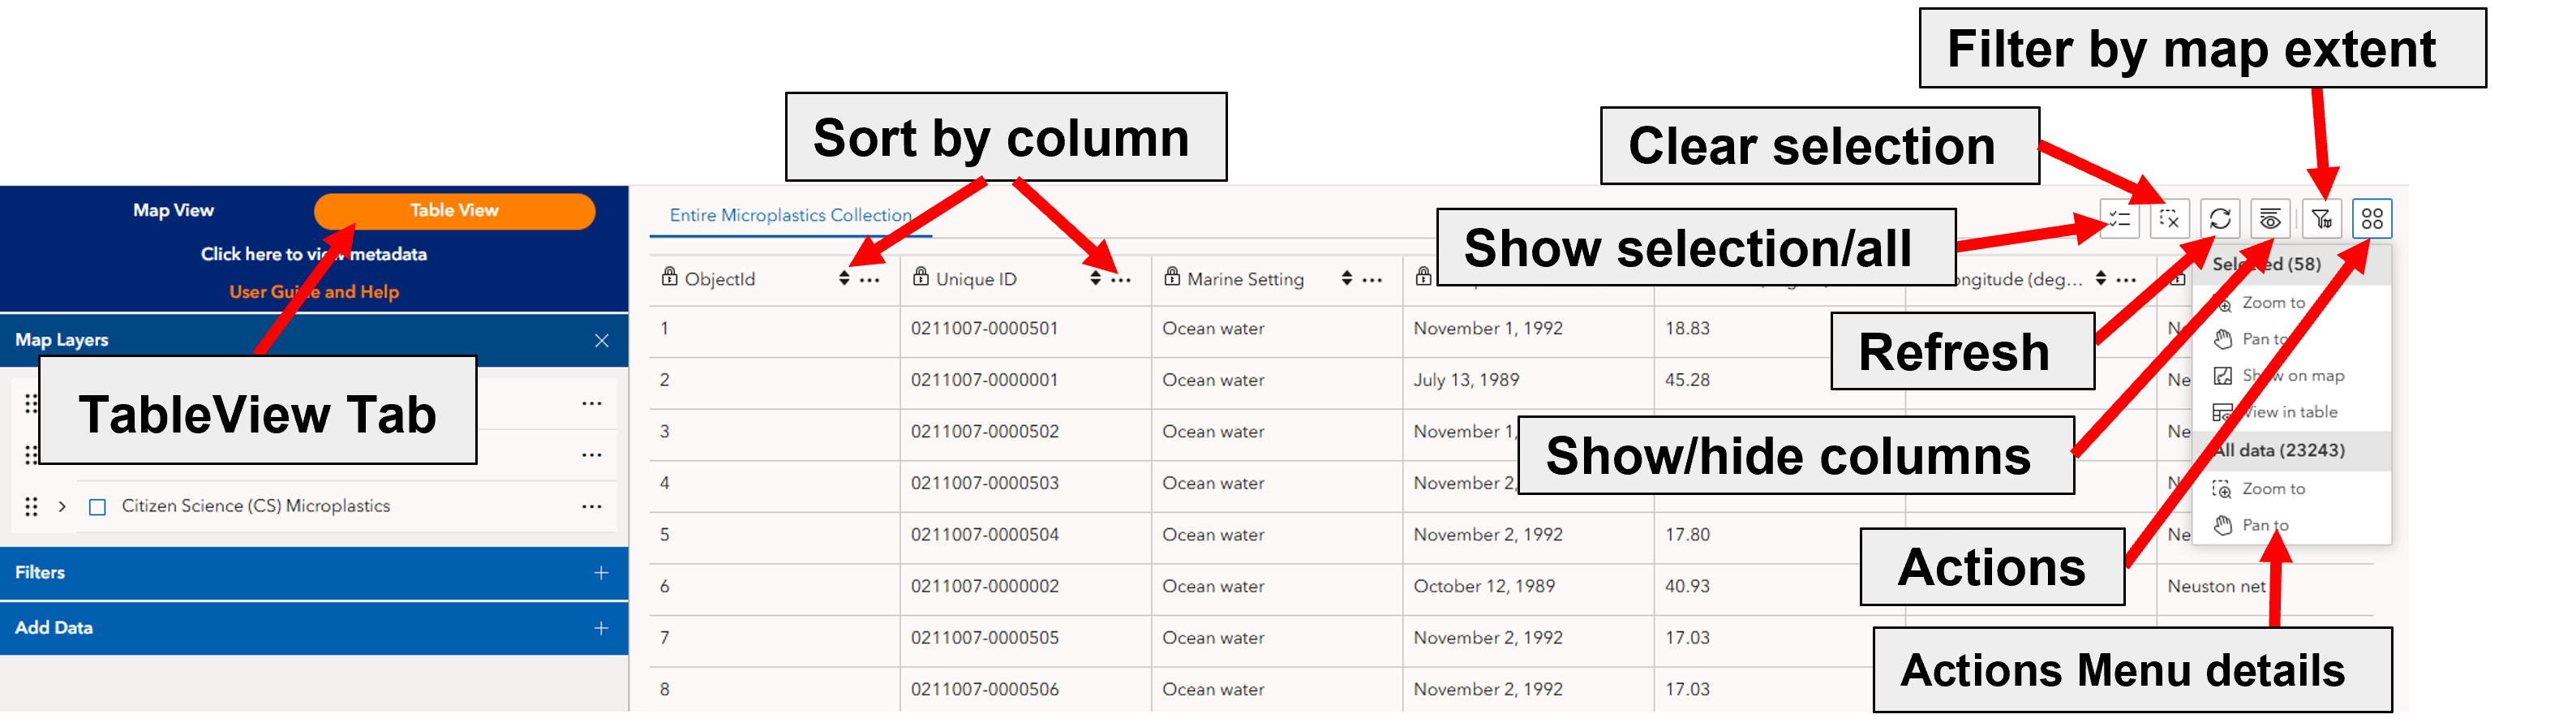
Sort by Column
Records can be sorted by clicking the sort controls within a column heading. Sorting allows records to be organized in ascending or descending order based on values such as sample date, latitude, longitude, concentration class, or other attributes.
Show Selection/All
The show selection/all button allows the user to switch between showing only the selected records or all the records currently on the selected layer tab.
Clear Selection
This button clears the current selection.
Refresh
This button refreshes the table view.
Show/Hide Columns
The show/hide columns button of the table allows specific fields to be displayed or hidden.
This tool can be used to customize the table and focus on attributes of interest. Available fields include sampling information, geographic information, concentration measurements, classification categories, organizational information, and reference information.
Filter by Map Extent
The filter by map extent button can be used to subset displayed records on the table that are only within the current map extent.
Actions Menu
The Actions Menu provides the following options:
- Zoom to selected records on the map.
- Pan to selected records on the map.
- Show on map (available if selected records are present) to show the selected records as a new map layer with the suffix “ table selection” in the map layer name. This new layer is visible when the user switches to the map view.
- View in table (available if selected records are present) to display the selected records as a new table tab with the suffix “ table selection” in the tab name.
- Export to download selected or all records of the current layer tab in the table.
Use the "Add Data" feature to import data layers by searching for personal ArcGIS contents, entering specific URLs or uploading data files directly. The supported formats are Shapefile, CSV, KML, GeoJSON, GPX (GPS Exchange Format) and FGDB.