New gridded products allow easier use and visualization of climate data

Temperature and precipitation averages and statistics are calculated every decade so we can put today’s weather into proper context and make better climate-related decisions. These 30-year averages, called “climate normals,” can be described as a benchmark of climate conditions across the United States. Normals are vital to many scientific, engineering, and economic interests. For example, a construction firm bidding on a job starting in four months can use normals to know how many rainy days to build into a schedule. Electric utilities can use heating and cooling degree day normals in planning base load factors, and temperature threshold exceedance frequencies for peak load assessment. An individual traveling for leisure can get an idea for a good time of year to visit a place, although in this and the other cases the actual weather can surprise them.
On the heels of last year’s decadal update to the 30-year climate normals, our scientists have released a new type of normals product: Monthly Gridded Climate Normals, which increase options for visualizing and studying climate data and make research easier for many users. Also, another product is being released for the first time: ENSO Gridded Climate Normals.
Monthly Gridded Climate Normals
Monthly Gridded Climate Normals, instead of being calculated at single locations across the United States, are calculated for the entire United States in a gridded format, which can make them easier to visualize on maps and use for calculations. Temperature and precipitation are averaged by month and provided in a high-resolution gridded format—1/24 by 1/24 degree longitude and latitude resolution (approximately 5 km). The calculations are based on monthly nClimGrid data developed by other NOAA and NCEI scientists. The dataset of monthly averages includes values for 1991–2020 (30-year normals), 2006–2020 (15-year normals), and 1901–2000 (last century average). The conventional normal suggested for most use cases is the 30-year normal for 1991-2020, but some expert use cases need a climatology that reflects the most recent state in a trending climate, 2006-2020. The longer average of 1901-2000 is referred to as the 20th Century Baseline, and is often used when examining climate change over time.
In a recent example, the Monthly Gridded Normals were used to illustrate changes in U.S. Climate Normals during the decadal update to new 30-year averages (1991–2020). Precipitation increased considerably in the eastern and north-central U.S., and decreased in the western and southwestern U.S. Temperature averages warmed across the U.S. except for the far north-central U.S., where they were about the same or even cooled slightly.
ENSO Gridded Climate Normals
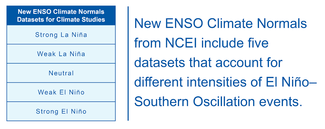
The release of new ENSO Gridded Climate Normals makes it easier than ever to visualize the potential impacts of ENSO on U.S. climate. In 2019, ENSO (El Niño–Southern Oscillation) Climate Normals were developed for the contiguous United States in order to take into account the influence of El Niño, La Niña, and climate change impacts. The dataset is described in an article authored by scientists from NCEI and the Cooperative Institute for Satellite Earth System Studies (CISESS). These data have been updated to use data through 2020, and included in this release to the public.
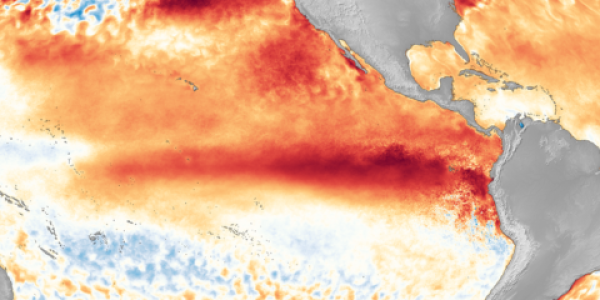
El Niño and La Niña events are part of the ENSO cycle, which affects weather and climate conditions worldwide. Over the continental United States, El Niño and La Niña events are each associated with areas that are colder-than-normal or warmer-than-normal, as well as areas that are drier-than-normal or wetter-than-normal. The averages in the ENSO Climate Normals dataset also consider an optimal climate normal (OCN) to account for climate change impacts and align the basis of the normals with the most recent climate conditions, 2006-2020 in this case. This provides users with a picture of what climate conditions may look like when a particular phase of ENSO occurs or is forecast by NOAA’s Climate Prediction Center.
Climatological normals are indispensable planning tools in a wide variety of industries, and as stated by the scientists involved in developing the dataset: “This new product can assist stakeholders in planning for a broad array of possible ENSO impacts in a changing climate.”


