The United States experienced its 7th warmest November and 10th warmest autumn

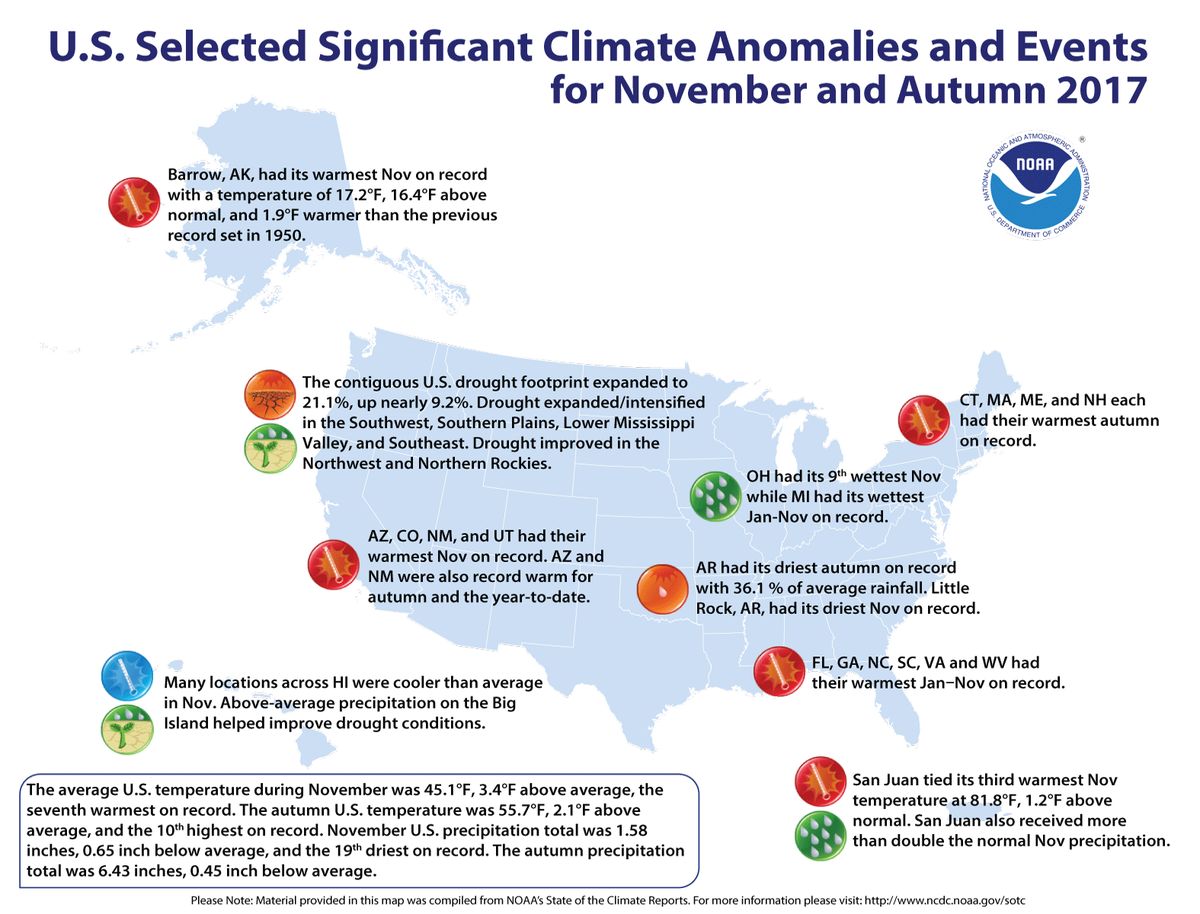
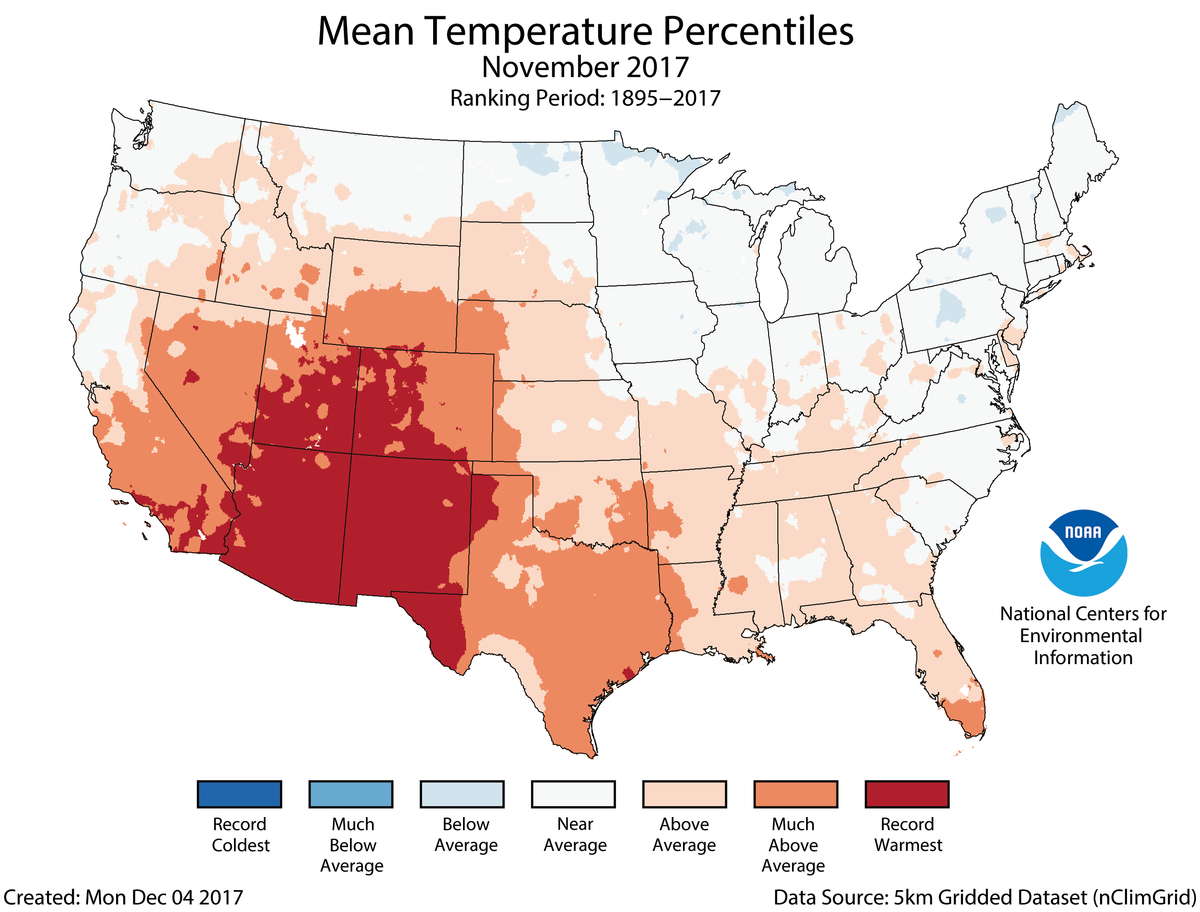
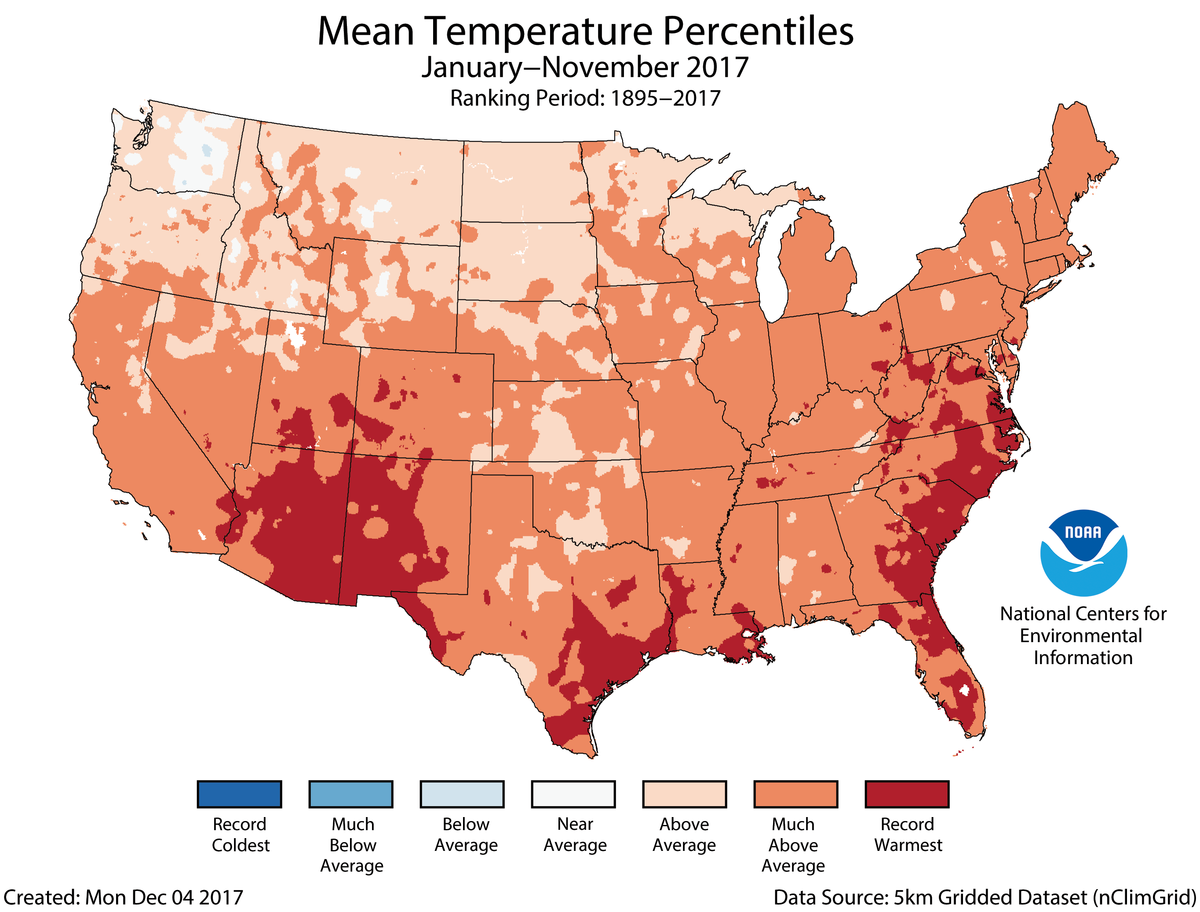
The November nationally averaged temperature was 45.1°F, 3.4°F above the 20th century average, and ranked as the seventh warmest on record. Record warmth spanned the Southwest with much-above-average temperatures stretching to the West Coast, Central Rockies, and Southern Plains. Near-average temperatures were observed across the North and along the East Coast. The autumn (September–November) temperature was 55.7°F, 2.1°F above the 20th century average, and the 10th warmest on record. Record autumn warmth was observed in the Southwest and New England. The year-to-date U.S. average temperature was the third warmest on record at 56.4°F, 2.6°F above average. Only January–November of 2012 and 2016 were warmer.
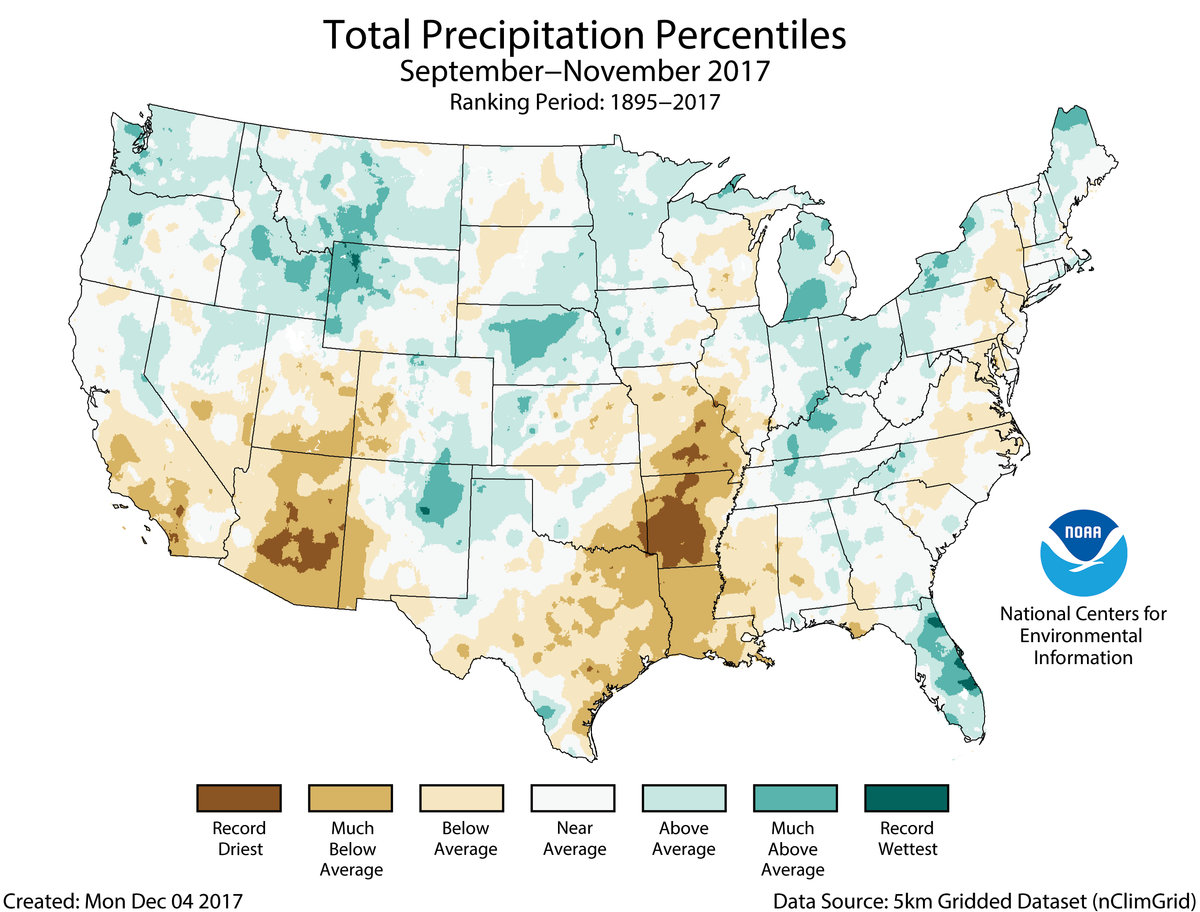
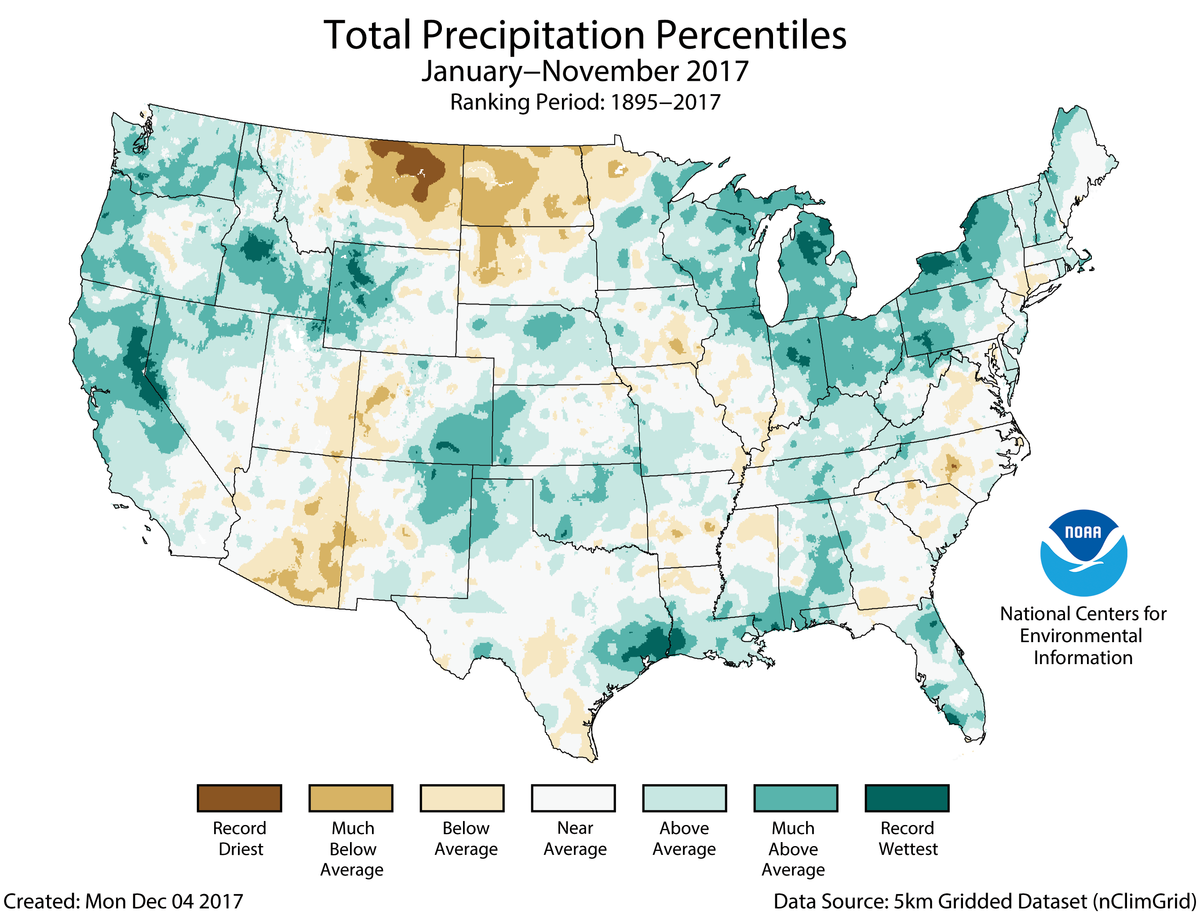
The national precipitation total was 1.58 inches, 0.65 inch below average, marking the 19th driest November on record. Below-average precipitation was observed for large parts of the nation, with drought developing and expanding in the Southwest, Southern Plains, Lower-Mississippi Valley, and Southeast. The autumn precipitation total was 6.43 inches, 0.45 inch below average, and ranked in the driest third of the historical record. Record dryness was observed in parts of the Southwest and Lower-Mississippi Valley. The year-to-date precipitation total for the nation was 30.60 inches, 3.01 inches above normal, and the ninth wettest on record.
See all November, seasonal, and year-to-date U.S. temperature and precipitation maps.
This monthly summary from NOAA’s National Centers for Environmental Information is part of the suite of climate information services NOAA provides to government, business, academia, and the public to support informed decision-making.
November Temperature
-
Much-above-average temperatures stretched from the California Coast into the Southwest, Central Rockies, and Southern Plains. Arizona, Colorado, New Mexico, and Utah each had their warmest November on record. The Arizona statewide average temperature of 57.7°F surpassed the previous record set in 2007 by 2.4°F. Near-average temperatures were observed across much of the northern U.S. and along much of the East Coast.
-
Much-above-average temperatures were observed along the western and northern coasts of Alaska where Arctic sea ice extent offshore was record and near-record low for the month. Barrow had its warmest November on record with a temperature of 17.2°F, 16.4°F above the 1981–2010 normal, and 1.9°F warmer than the previous record in 1950.
November Precipitation
-
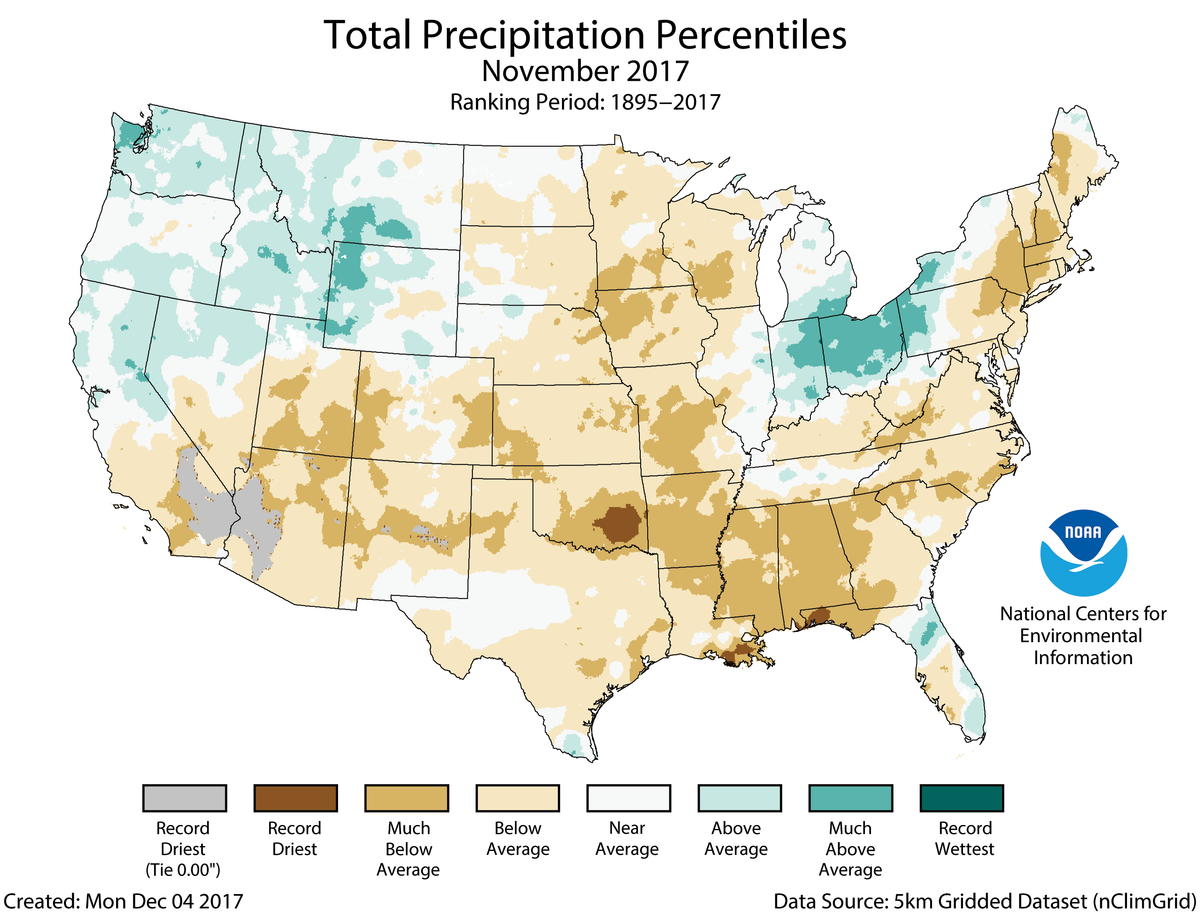
Below-average precipitation accumulated for most locations from the Southwest into the Great Plains, Southeast, and along the East Coast. Record low precipitation totals were reported in parts of the Southwest and deep South, with five states having the tenth driest, or drier, November on record. Mississippi ranked third driest, Alabama and Arkansas fourth driest, Oklahoma fifth driest, and Louisiana tenth driest. Little Rock, Arkansas, had its driest November on record with only 0.41 inch of rainfall.
-
Above-average precipitation was observed in the Northwest, Northern Rockies, and parts of the Midwest. Ohio had its ninth wettest November on record.
-
According to the November 28 U.S. Drought Monitor report, 21.1 percent of the contiguous U.S. was in drought, up nearly 9.2 percent compared to the end of October. Drought developed, expanded and intensified in the Southwest, Southern Plains, Lower Mississippi Valley, and Southeast. Drought improved in the Northwest, Northern Rockies, and parts of the Midwest. Drought also improved for much of Hawaii.
Autumn (September–November) Temperature
-
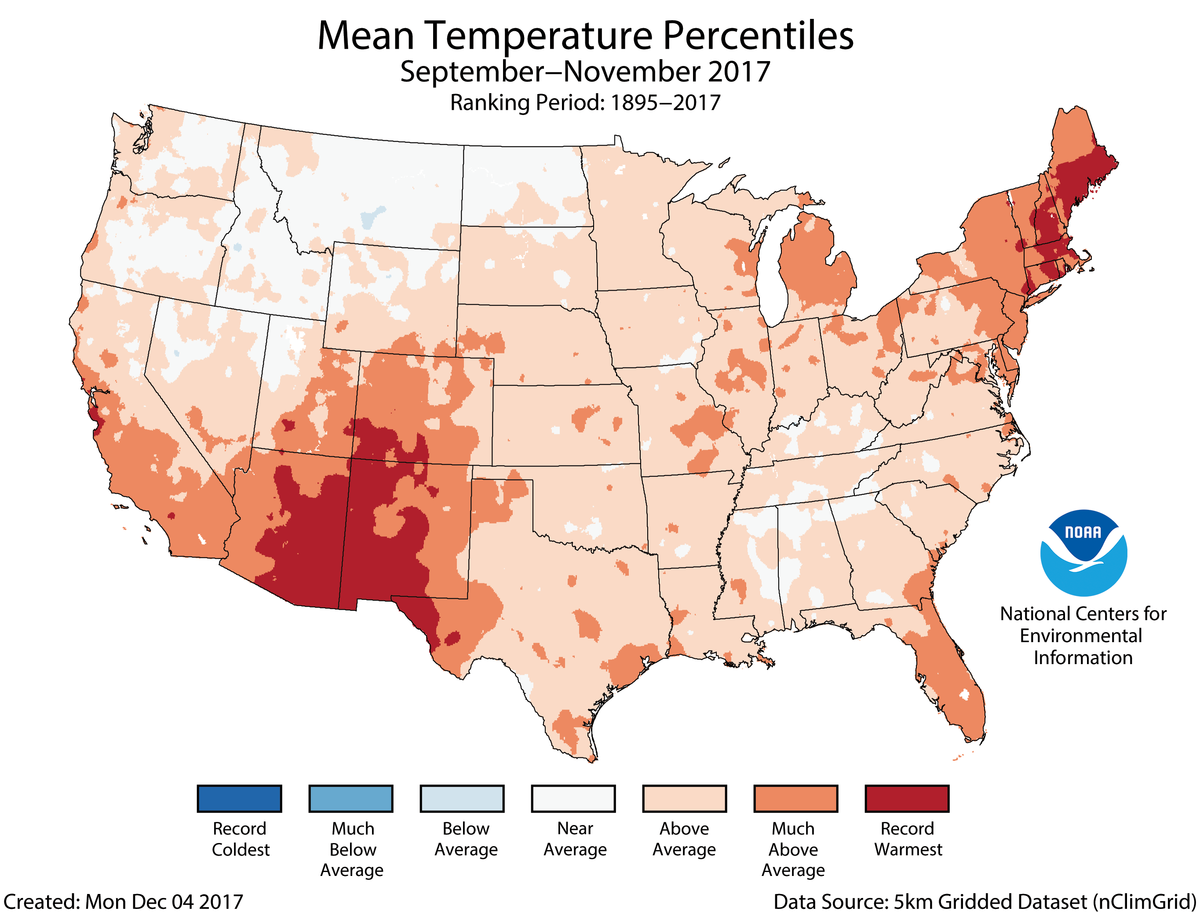
Above-average temperatures spanned most of the nation during autumn, with the exception of the Northern Rockies and northern High Plains. Record warmth was observed in the Southwest and New England, where Arizona, New Mexico, Connecticut, Maine, Massachusetts, and New Hampshire were each record warm. The record autumn warmth in the Southwest was driven largely by warm November temperatures, while the record warmth in New England was mostly due to warm October temperatures.
Autumn Precipitation
-
Below-average precipitation was observed for parts of the Southwest, Southern Plains, Lower Mississippi Valley, and Mid-Atlantic. Parts of the Southwest, including Flagstaff and Phoenix, Arizona, were record dry. Arkansas was also record dry, receiving only 36.1 percent of average rainfall statewide. Little Rock, Arkansas, received just 2.24 inches of precipitation during the season, dipping below the previous record of 2.90 inches set in 1904.
-
Above-average precipitation was observed in the Northwest, Northern Rockies, and parts of the Plains, Midwest, Southeast, and Northeast.
Year-to-Date (January–November) Temperature
-
Above-average temperatures spanned the nation during the year-to-date. Two states in the Southwest—Arizona and New Mexico—and six states in the East—Florida, Georgia, North Carolina, South Carolina, Virginia, and West Virginia—were record warm for the first 11 months of the year.
Year-to-Date Precipitation
-
Many locations had a wetter-than-average year-to-date with much-above-average precipitation totals across the West and the Great Lakes. Michigan had its wettest January–November on record with 37.31 inches of precipitation, 8.19 inches above average. This bested the previous record of 37.04 inches set in 1985.
-
Parts of the northern Plains were drier than normal for the year-to-date. North Dakota had the eighth driest January–November, resulting in large part from the significant drought there earlier this year.
Extremes
-
The U.S. Climate Extremes Index (USCEI) for the year-to-date was the third highest value on record at more than double the average. On the national scale, extremes in warm maximum and minimum temperatures, one-day precipitation totals, days with precipitation and landfalling tropical cyclones contributed to the elevated USCEI. The USCEI is an index that tracks extremes (falling in the upper or lower 10 percent of the record) in temperature, precipitation, drought, and landfalling tropical cyclones across the contiguous U.S.
A Note on Alaska Data
In early December 2017, due to a sharp, but real, increase in temperature during the 21st century at Barrow (Utqiaġvik), NCEI’s quality assurance algorithms retroactively rejected the station’s monthly temperatures dating to late summer 2016. Because the Barrow temperature was not considered, it resulted in an underestimate of recent monthly temperatures for Alaska Climate Division 1 and to a lesser extent the Alaska statewide average. NCEI is working to correct this issue in the coming weeks. The station’s daily data are available and correct in the Global Historical Climatology Network–Daily (GHCN-D) dataset.

