Use the form below to select from a collection of monthly summaries recapping climate-related occurrences on both a global and national scale.
National Climate ReportOctober 2021

National Overview

October Temperature
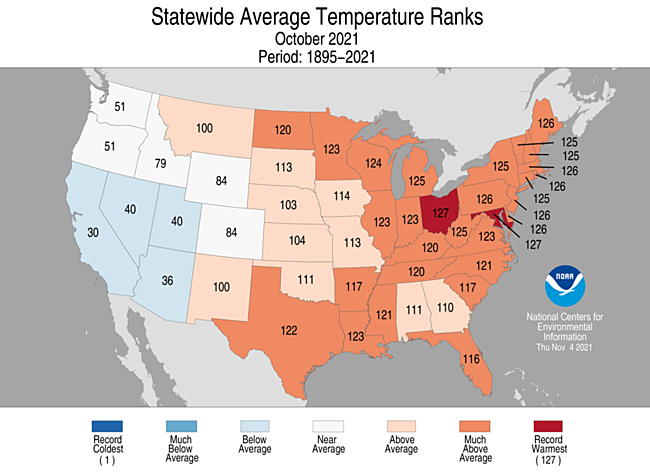
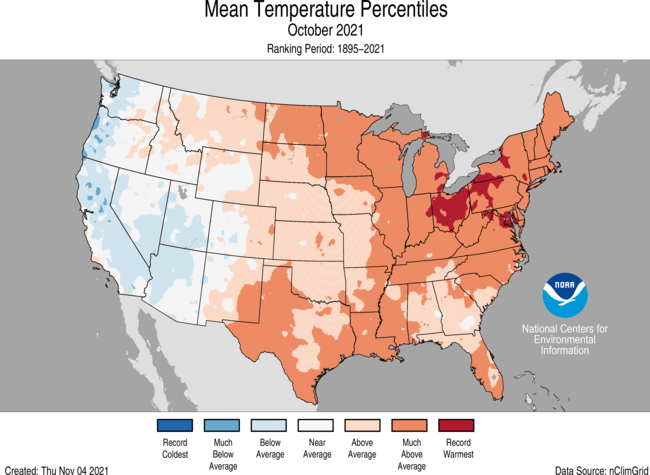
- For October, the average contiguous U.S. temperature was 57.0°F, 2.9°F above the 20th century average. This ranked sixth warmest in the 127-year record.
- Temperatures were above average from the Rocky Mountains to the East Coast. Ohio and Maryland ranked warmest on record for October while Pennsylvania, Delaware, New Jersey, Massachusetts, Rhode Island and Maine each ranked second warmest. Temperatures were below average across portions of the West Coast and Southwest.
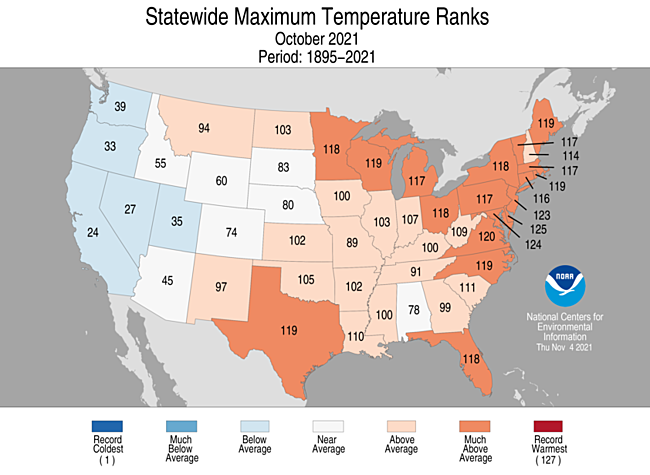
- The nationally averaged maximum temperature (daytime highs) was warmer than average during October at 68.6°F, 1.8°F above average, ranking in the warmest one-third of the 127-year record. Delaware ranked third warmest for maximum temperatures in October, while much of the Great Lakes, Deep South and East Coast experienced above-average daytime high temperature for the month. Much of the western U.S. had daytime high temperatures that were below average.
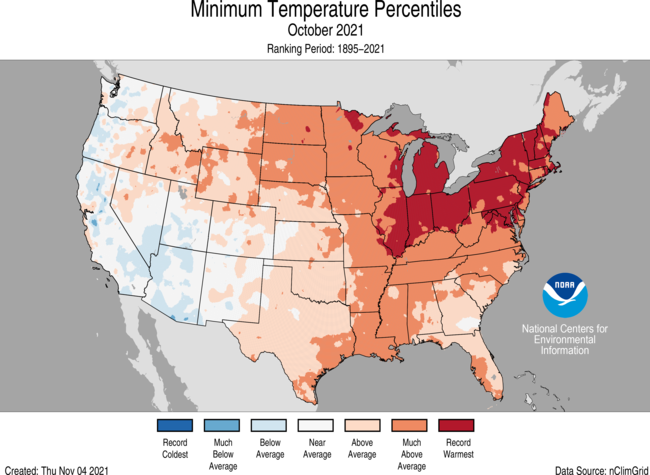
- The nationally averaged minimum temperature (overnight lows) during October was 45.3°F, 3.9°F above average, also ranking fourth warmest in the 127-year record. Fourteen States from the Great Lakes to New England ranked warmest, while much of the West experienced average and below-average overnight low temperatures during October.
- Alaska ranked in the middle third of the October record with a statewide average temperature of 28.0°F, 2.5°F above the long-term average. Temperatures were above average across portions of the Alaskan Interior and North Slope and slightly below average across the Panhandle. Despite the year-to-year downward trend in October sea ice extent, the average Chukchi Sea ice extent during October was the highest seen since 2001.
- As of November 5, there were 3,961 daily warm high (1,173) and low (2,788) temperature records tied or broken during October. This was slightly more than two times the 1,834 cold daily high (1,177) and low (657) temperature records set during the month.
- Based on NOAA's Residential Energy Demand Temperature Index (REDTI), the contiguous U.S. temperature-related energy demand during October was 13 percent of average and ranked fourth lowest in the 127-year period of record.
October Precipitation
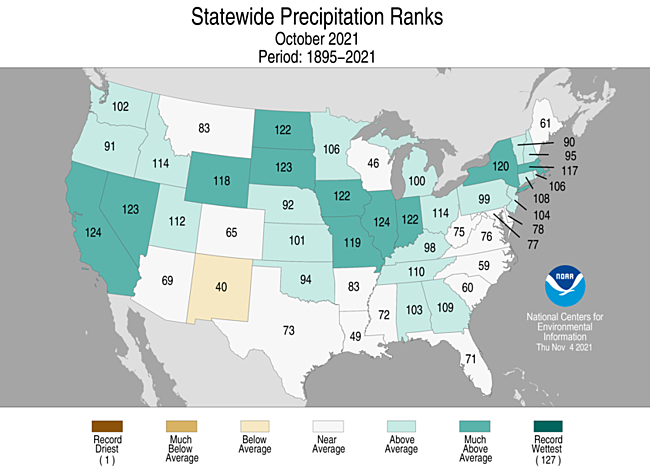
- The October precipitation total for the contiguous U.S. was 3.11 inches, 0.95 inch above average, ranking ninth wettest in the 127-year period of record.
- Precipitation was above average across parts of the West, Plains, Great Lakes, Midwest, Southeast and Northeast. California and Illinois ranked fourth wettest on record for October. Precipitation was below average across portions of the Southwest, western Great Lakes and western portions of the central and southern Plains.
- Multiple atmospheric river (AR) events occurred from October 19-26. The AR Category 5 event on October 24 brought record rainfall to portions of central California. Sacramento, Blue Canyon and Santa Rosa each reported their wettest 24-hour period on record during this event. Heavy mountain snowfall made travel through passes nearly impossible.
- While the AR events were impacting the West Coast, the East Coast experienced an early fall Nor’easter. On October 26, high winds and heavy rainfall led to flash flooding and power outages from New Jersey to Massachusetts.
- Alaska’s statewide average of 4.50 inches of precipitation in October was 0.11 inch above the long-term average and ranked in the middle one-third of the 97-year record. A late-month atmospheric river event transported ample amounts of moisture into south-central Alaska. Alyeska reported its wettest single day and 3-day period on record with 9.53 inches and 15.05 inches of precipitation, respectively. Portage Glacier Visitors Center received nearly 20 inches of rain during the last three days of October with accumulations continuing into early November.
- According to the November 2 U.S. Drought Monitor, approximately 48 percent of the contiguous U.S. was in drought, a little more than what was observed at the end of September. Drought conditions expanded and/or intensified across parts of the northern Great Lakes, Texas, central High Plains and emerged in portions of the eastern Carolinas. Drought intensity became less severe across much of the West, northern Plains, Oklahoma, portions of the Midwest and was nearly eliminated across Puerto Rico.
Extremes
- Conveyor belts of Pacific moisture, defined as atmospheric rivers, impacted much of the central West Coast from October 19-26. On October 24, a Category 5 (exceptional) atmospheric river event brought record rainfall to parts of central California. The heavy rain triggered multiple landslides, yet helped partially snuff out the wildfire season and lessened the drought severity across this portion of the West.
- Sacramento, CA, set a record of 211 days without measurable precipitation in 2021. This streak ended on October 17. On October 24, a category 5 atmospheric river event brought 5.45 inches of rainfall to Sacramento, breaking the previous single-day precipitation record of 5.28 inches, set in 1880.
- An all-time record low pressure system (942.5mb) for a storm in this region developed in the eastern Pacific Ocean and strengthened rapidly on October 24, generating hurricane force winds and wave heights up to 45 feet off the coast of Washington and Oregon while channeling several waves of Pacific moisture toward the West Coast.
- A persistent ridge of high pressure across the eastern U.S. contributed to the record warm October temperatures observed in locations spanning from Milwaukee to New Haven, CT. Record-warm mild nights were observed from the Great Lakes to southern New England and were the main driver for these warm monthly temperatures.
- Preliminary tornado counts across the U.S. during October were second most on record for the month with a count of 146. Only preliminary counts in 2018 ranked higher with 159 tornadoes reported. Oklahoma reported a record 31 tornadoes for October, which exceeds the previous record of 27 set in 1998.
January-October Temperature
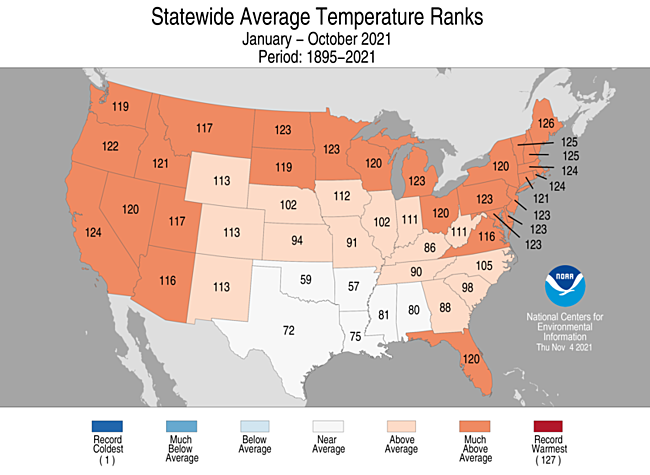
- For the year-to-date, the contiguous U.S. temperature was 57.0°F, 2.0°F above the 20th century average, and ranked ninth warmest in the January–October record.
- Year-to-date temperatures were above average across much of the Lower 48. Maine ranked second warmest on record while Vermont and New Hampshire ranked third warmest on record for this 10-month period. Temperatures were below average across portions of the Deep South.
- The contiguous U.S. average maximum (daytime) temperature during January-October was 69.0°F, 1.7°F above the 20th century average, ranking ninth warmest in the 127-year record. Maximum temperatures were above average across much of the West, northern Plains, Great Lakes, Northeast and Florida with North Dakota ranking second warmest on record. Maximum temperatures were below average across portions of the southern Plains, lower-Mississippi River Valley and Southeast.
- Temperatures across Alaska ranked in the middle third of the historical record for January-October with a statewide average temperature of 30.6°F, 1.0°F above the long-term average. Temperatures were above average across portions of southwestern and northeastern Alaska.
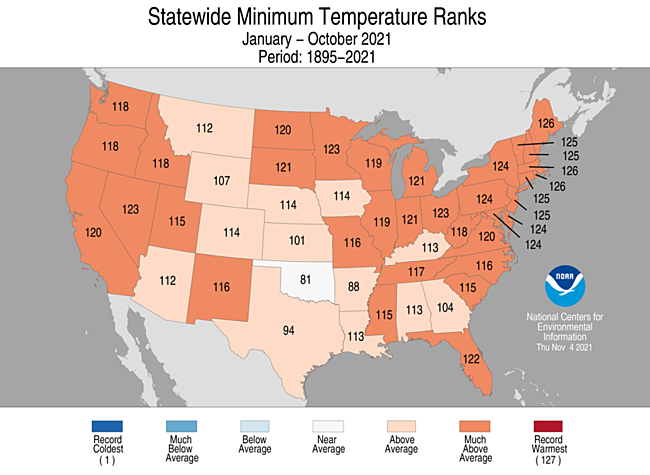
- The contiguous U.S. January-October minimum (nighttime) temperature was 45.0°F, 2.3°F above average, and ranked fifth warmest on record. Above-average minimum temperatures were observed across most of the CONUS. Minimum temperatures averaged across Massachussets, Rhode Island and Maine were second warmest on record for this year-to-date period. No state ranked below average.
- Based on REDTI, the contiguous U.S. temperature-related energy demand during January-October was 66 percent of average and ranked in the lowest one-third of the 127-year period of record.
January-October Precipitation
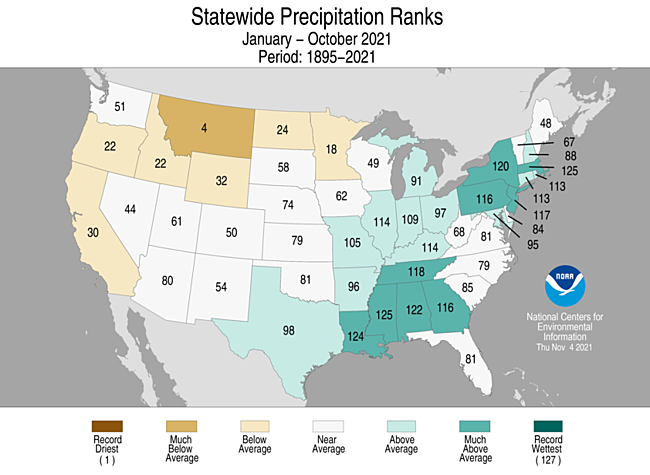
- For the year-to-date, the national precipitation total was 26.74 inches, 1.38 inches above average, ranking in the wettest one-third of the January-October record.
- January-October precipitation was above average from the Deep South to the Great Lakes and into the Northeast. Mississippi and Massachusetts ranked third wettest while Louisiana ranked fourth wettest for this year-to-date period. Precipitation was below average across portions of the West, northern Plains, Great Lakes and New England. Montana ranked fourth driest for this period.
- Across Alaska, year-to-date precipitation was above average. Cook Inlet was drier than average while much of the Interior regions, West Coast, North Slope and Panhandle received above-average precipitation for the first 10 months of the year.
Extremes
- The USCEI for the year-to-date was 90 percent above average and ranked fifth highest in the 112-year period of record. Extremes in warm maximum and minimum temperatures as well as dry PDSI and extremes in 1-day precipitation contributed to this elevated value.
- On the regional scale, the West ranked highest on record while the Northeast ranked second highest for January-October. Elevated extremes across both regions were due to widespread warm maximum and minimum temperatures. The West also had extensive extremes in dry PDSI, 1-day precipitation and days without precipitation. The Northeast had elevated extremes in 1-day precipitation events and days with precipitation.
Regional Highlights
These regional summaries were provided by the six Regional Climate Centers and reflect conditions in their respective regions. These six regions differ spatially from the nine climatic regions of the National Centers for Environmental Information.
Northeast Region (Information provided by the Northeast Regional Climate Center)
- October 2021 was the warmest October since 1895 for the Northeast. The region’s average temperature of 55.9 degrees F (13.3 degrees C) was 5.7 degrees F (3.2 degrees C) warmer than normal. All twelve Northeast states experienced a warmer-than-normal October, with average temperature departures ranging from 4.7 degrees F (2.6 degrees C) in Connecticut to 6.3 degrees F (3.5 degrees C) in Maryland, its warmest October on record. This October ranked as the second warmest on record for Delaware, Maine, Massachusetts, New Jersey, Pennsylvania, and Rhode Island and as the third warmest on record for Connecticut, New Hampshire, New York, Vermont, and West Virginia. In addition, October 2021 was the warmest October on record for six major climate sites: Syracuse, New York; Dulles Airport, Virginia: Newark, New Jersey; and Harrisburg, Williamsport, and Scranton, Pennsylvania.
- The Northeast received 4.83 inches (122.68 mm) of precipitation in October, which was 115 percent of normal. Six of the 12 Northeast states were wetter than normal in October. State precipitation ranged from 76 percent of normal in Maine to 153 percent of normal in New York, the state’s eighth wettest October on record. In addition, Massachusetts had its 11th wettest October.
- The U.S. Drought Monitor released on October 7 showed 1 percent of the Northeast in severe drought, 2 percent in moderate drought, and 7 percent as abnormally dry. There were minimal changes during October, with drought persisting in parts of northern New England and the slight expansion of abnormal dryness in portions of northern New England, northern New York, and West Virginia. The U.S. Drought Monitor released on October 28 showed 1 percent of the Northeast in severe drought, 2 percent in moderate drought, and 10 percent as abnormally dry. Below-normal or lower streamflow and/or groundwater levels persisted in parts of northern New York and northern New England, particularly Maine, during the month. As of late October, the number of dry wells reported in Maine was 20. Drought stress caused some pine trees in Maine to drop more needles than usual.
- On October 16, severe thunderstorms moved through the Northeast, with most of the storm damage consisting of downed trees and wires occurring in Pennsylvania, New York, and Vermont. Three weak tornadoes touched down in Pennsylvania, two in Beaver County and one along the border of Jefferson and Elk counties. The main damage consisted of dozens of uprooted or snapped trees, with one injury reported. In addition, straight-line winds of up to 80 mph (36 m/s) caused widely scattered tree damage in parts of Butler County, Pennsylvania. On October 21, nine tornadoes touched down in southwestern Pennsylvania, with the strongest being an EF-2 that traveled more than 15 miles across Washington County. Tornado damage included structural damage to several homes and outbuildings and dozens of snapped and uprooted trees. Preliminary data indicates this October and 2021 are one of the most active Octobers/years for tornadoes in the Pennsylvania counties in the Pittsburgh National Weather Service office’s service area. From October 25 to 27, a storm system moving through the Ohio Valley and a low moving up the East Coast merged, forming a rapidly intensifying nor’easter along the New England coast. Preliminary data indicated Nantucket, Massachusetts, recorded its lowest October pressure on record. The strongest wind gusts reached 70 to 90 mph (31 to 40 m/s) in parts of southern New England, with a peak gust of 94 mph (42 m/s) in Edgartown, Massachusetts. Downed trees and wires blocked roads and damaged buildings and vehicles. More than 485,000 customers lost power in Massachusetts, and some schools were closed. The storm system dropped 4 to 7 inches (101 to 178 mm) of rain on parts of central/southeastern New York, southwestern Connecticut, and northern/central New Jersey. Flash flooding led to road closures, water rescues, some evacuations, and watering entering homes and basements. A Flash Flood Emergency was issued for part of Cayuga County, New York, where water levels reached major flood stage. A few days later, from October 29 to 31, another storm system moved through the region. Persistent onshore winds, with peak gusts between 40 and 70 mph (18 to 31 m/s), led to water levels not seen in 10 to 20 years along the Chesapeake Bay and Delaware Bay and their tidal tributaries such as the Potomac River and Delaware River. In fact, at some gauges, water levels were record or near-record high. For example, the Patuxent River at Solomons Island, Maryland, reached 4.82 feet (1.47 m), beating the old record of 4.80 feet (1.46 m) set by Hurricane Isabel on September 19, 2003. Storm reports noted many road closures and that some structures such as houses and garages took on water, leading to some evacuations. The strong wind gusts also downed trees in wires. The storm system also dropped heavy rain on parts of New York and New England, with the greatest storm totals of 4 to 7 inches (101 to 178 mm) in Maine. Localized flooding led to road closures in portions of central New York and coastal Maine. Mild October temperatures contributed to Caribou, Maine, having its latest first fall frost on record. This year’s frost occurred on October 25, beating the previous record of October 17, 1970. In addition, the first fall occurrence of a temperature of less than 50 degrees F (10 degrees C) was the latest on record for sites such as Providence, Rhode Island; Bridgeport, Connecticut; Boston, Massachusetts; Newark, New Jersey; and Kennedy and LaGuardia Airports in New York.
- For more information, please visit the Northeast Regional Climate Center Home Page.
Midwest Region (Information provided by the Midwest Regional Climate Center)
- Temperatures across the Midwest were unseasonably warm for October. The region averaged 57.1 degrees F (13.9 C), which was 5.7 degrees F (3.1 C) above normal. This ranked as the fourth warmest October on record dating back to 1895. All states were warmer-than-normal, with temperature departures ranging from 3.8 degrees F (2.1 C) above normal in Missouri to 6.9 degrees F (3.8 C) above normal in Wisconsin. Ohio had the warmest October on record dating back 127 years. Illinois (5th, tied), Indiana (5th), Michigan (3rd), Minnesota (5th), and Wisconsin (4th) all had a top five warmest October (records from 1895-2021). Minimum temperatures were a major driving factor for the October warmth. Monthly minimum temperatures ranged from 3-11 degrees F (2-6 C) above normal, and 808 maximum low temperature records were recorded during October. Nearly all the maximum low temperature records occurred during the first 15 days of the month. Warm minimum temperatures also resulted in the first fall freeze across the upper Midwest being delayed by two to four weeks compared to the 1981-2010 median freeze date. By the end of October, few locations across the lower Midwest had reached the first fall freeze. Monthly maximum temperatures were 1-7 degrees F (1-4 C) above normal, and 133 maximum high temperature records were recorded during October.
- Precipitation was wetter-than-normal during October. Average precipitation was 4.72 inches (120 mm), which was 1.62 inches (41 mm) above normal. This ranked as the 6th wettest October on record dating back to 1895. Precipitation amounts across the Midwest varied from 3-10 inches (76-254 mm), except for a dry area centered around central Wisconsin where monthly precipitation ranged from 1-3 inches. All states had above-normal precipitation except Wisconsin, which was 0.88 inches (22 mm) below normal. Illinois (4th), Indiana (5th), Iowa (6th), Missouri (7th, tied), and Ohio (8th) all had precipitation totals within the top eight wettest on record dating back 127 years. There were 697 high precipitation records in October. Illinois (156) and Iowa (153) had the greatest number of precipitation records.
- Drought conditions affected about 19 percent of the Midwest by late October, with about 17 percent of the region flagged as abnormally dry according to the U.S. Drought Monitor. Although drought persisted, conditions did improve throughout the month in Minnesota, Iowa, and Illinois. Wisconsin and the Upper Peninsula of Michigan saw the greatest expansion and intensification of drought in the Midwest. About 94 percent of Wisconsin was abnormally dry or in drought compared to 38 percent 3 months ago. In response to long-term dryness and drought, most US Geological Survey (USGS) streamflow gauges in Minnesota, Wisconsin, and the Upper Peninsula of Michigan had river flows in the 0-24th percentile by late October.
- Wetter-than-normal conditions caused corn harvest to slow in the eastern portion of the region. Kentucky, Indiana, and Ohio were 3-8 percent behind the 5-year average. Northern areas, which had a head-start on corn harvest last month, continued to track 10-22 percent ahead of the 5-year average. Soybean harvest was slowed significantly across the Midwest in October, with only three states (Iowa, Minnesota, and Wisconsin) ahead of the 5-year average. Soybean harvest in Illinois, Indiana, and Michigan were 11-15 percent behind the 5-year average. Sugarbeet harvest, which is negatively impacted by warm temperatures, was 15 percent behind the 5-year average in Minnesota. Delays in the first fall freeze resulted in continued insect pressure in the region. An Extension specialist in Ohio reported ongoing army worm damage through late October, which was extremely rare.
- An intense storm system that moved across the Midwest on October 24-25 brought 2-4 inches of rainfall through an area from Iowa to southern Michigan and northwest Ohio. Heavy rainfall resulted in numerous streams in Illinois, Indiana, and southern Michigan, to be near flood stage or in minor flood stage according to the USGS. Flooding along these river systems continued through the rest of October.
- Severe weather was reported on 14 out of 31 days in October across the Midwest. This included 71 tornadoes reports, 116 severe wind reports, and 6 hail reports. There was one injury associated with a tornado in Ohio on October 15. Two EF-3 tornadoes in Missouri on October 24 each resulted in one injury. October 24 was the most active severe weather day of the month, with 22 tornadoes and 39 wind events reports across Missouri, Illinois, and Indiana.
- For further details on the weather and climate events in the Midwest, see the weekly and monthly reports at the Midwest Climate Watch page.
Southeast Region (Information provided by the Southeast Regional Climate Center)
- Temperatures were above average across much of the Southeast region and Puerto Rico for the month of October. Monthly mean temperatures were at least 2 degrees F (1.1 degrees C) above average for over 65 percent of the 165 long-term (i.e., period of record equaling or exceeding 50 years) stations across the region. There were six stations that observed their warmest October on record, including Clayton, NC (1955-2021) and Williamsburg, VA (1948-2021). Maximum temperatures ranged from 6.5 degrees F (3.6 degrees C) above normal in Lynchburg, VA (1893-2021; 2nd warmest) to 1.6 degrees F (0.9 degrees C) below normal in Brookwood, AL (1930-2021). Fort Myers, FL (1892-2021; 17 days) and Plant City, FL (1892-2021; 17 days) both had a record number of days with a daily maximum temperature at 90 degrees F (32 degrees C) or above, whereas San Juan, PR (1898-2021; 25 days) tied the record. Daily temperature minimums ranged from 9.2 degrees F (5.1 degrees C) above normal in Boydton, VA (1948-2021; 1st warmest) to 1.4 degrees F (0.8 degrees C) below normal in Fort Pierce, FL (1901-2021). The warmest weather of the month occurred from the 13th through the 16th, as a warm and humid air mass stagnated over the region. Daily maximum temperatures exceeded 80 degrees F (27 degrees C) across portions of every state, while nighttime minimum temperatures exceeded 60 degrees F (15.6 degrees C). In contrast, the coldest weather of the month across the Southeast occurred on the 27th through the 29th, as the circulation around a departing mid-latitude cyclone ushered in cooler and drier air from Canada. Daily minimum temperatures fell below 50 degrees F (10 degrees C) across portions of every state including Florida, with some locations in the higher elevations of North Carolina and Virginia falling below 30 degrees F (-1.1 degrees C), prompting frost and freeze advisories. Indeed, Mt Mitchell (1925-2021) had a minimum temperature of 25 degrees F (-3.9 degrees C) and Waynesville, NC had a minimum temperature of 29 degrees F (-1.7 degrees C).
- Precipitation varied across the Southeast region for October, with a few wet and dry extremes recorded. The driest locations were found across much of North Carolina, South Carolina, eastern Florida, and Puerto Rico. Monthly precipitation totals ranged from 70 to less than 25 percent of normal across these locations. Indeed, Wilmington, NC (1871-2021) only measured 1.14 inches (29 mm) of precipitation, which was more than 3 inches (76 mm) below average. Vero Beach, FL (1923-2021) only measured 1.37 inches (35 mm) of rain, almost 4 inches (102 mm) below average, making this the 9th driest October on record. The wettest locations for the month were located across western North Carolina, central Georgia, the Florida Panhandle, and parts of Alabama. Precipitation totals ranged from 150 to 200 percent of normal. Highlands, NC (1871-2021; 4th wettest) measured 15.72 inches (399 mm) of precipitation, over 9 inches (229 mm) above normal. Most of this fell on October 6th – 8th due to a slow-moving frontal boundary, as Highlands, NC reported 12.13 inches (308 mm) of rainfall. As the frontal boundary progressed eastward, 4.96 inches (126 mm) of rain fell in Raleigh, NC (1887-2021) on October 9th, making this the 4th wettest October day on record and tied for 8th wettest day overall. Columbus, GA (1891-2021) observed its wettest October with 8.58 inches (218 mm), and 5.24 inches (133 mm) fell on October 4th, making it the wettest October day on record. Pensacola, FL (1879-2021) also observed heavy rain on October 4th with 8.23 inches (209 mm) recorded, making this the 4th wettest October day on record. On October 30th, snow was reported in the mountains of North Carolina and Virginia, with Mt Mitchell, NC and the West Point, VA each measuring a trace on October 30th.
- There were 53 reports of severe weather across the Southeast during October, which is 115 percent of the median monthly frequency of 46 reports during 2000-2019. There were no confirmed tornadoes reported for the month, which is 10 below the monthly average. There was one report of hail for the month, which has an average of 3 reports. The hail was quarter sized (1 inch) and occurred in Cullman County, AL on the 6th, with no damage reported. There were 50 wind reports for the month, which is 152 percent of the average (33 reports). Thunderstorms produced wind gusts of 63 mph (28 m/s) in Cape Henry County, VA on the 16th but no damage was reported. Strong thunderstorm outflow winds along a cold front, gusted to 64 mph (29 m/s) in Fairfax, VA on October 25th. Several tree branches were downed, but no injuries were reported.
- Drought intensified slightly across North Carolina, and abnormally dry conditions (D0) increased in coverage across portions of South Carolina, Georgia and Florida in October. At the beginning of the month, pockets of abnormally dry conditions (D0) were found in Virginia, North Carolina and South Carolina. By the end of the month, these pockets of dryness (D0) expanded, with a small area of moderate drought (D1) developing in eastern North Carolina. Drought conditions improved across Puerto Rico, with a small pocket of moderate drought (D1) in the south-western part of the island and pockets of abnormally dry conditions (D0) elsewhere by the end of the month. Abnormally dry conditions (D0) developed in the citrus growing region of Florida by the end of the month, forcing farmers to irrigate in several areas. Rains in the Florida Panhandle throughout the month caused disease pressure on field crops, however there were no impacts to the harvesting. Similarly, in Georgia, producers observed boll rot on the cotton due to the wet conditions. With the cooler conditions, many cattle producers planted winter grazing and began feeding hay. The rains in Alabama helped with the germination of newly planted grains; however, farmers noted issues in cotton quality due to the wet October. The drier conditions in South Carolina helped many farmers complete cotton and peanut harvesting.
- For more information, please visit the Southeast Regional Climate Center Home Page.
High Plains Region (Information provided by the High Plains Regional Climate Center)
- Temperature Temperatures for October remained above normal for most of the High Plains. The temperature departure gradient stretched northeast with the southwestern portion of the region observing temperatures below-normal and the northeastern portion observing the greatest departure of above-normal temperatures. The Rockies, in western Colorado, observed temperatures 2 to 4 degrees F (1.1 to 2.2 degrees C) below normal, while the Dakotas observed the highest departure from normal with temperatures 4 to 8 degrees F (2.2 to 4.5 degrees C) above normal. As a result of these above-normal temperatures in the Dakotas, a few locations ranked in the top 10 warmest October on record (see page 6 for October rankings). Dickinson, ND observed its 5th warmest October on record with an average temperature of 49.1 degrees F (9.5 degrees C). Grand Forks, ND tied a record set in 1900 with its 10th warmest October on record with an average temperature of 49.4 degrees F (9.7 degrees C). While October 2021 only ranked as the 10th warmest for Grand Forks, this was a departure of 6.2 degrees F (3.5 degrees C) above normal. Above normal temperatures in North Dakota provided challenges to some deer hunters. Lower temperatures are ideal for deer hunting because it increases deer activity as they look for more food to store energy and keep their bodies warm. Without these cooler temperatures, the deer are remaining in the brush longer and are less likely to come out during the middle of the day making it harder for deer hunters in the region.
- Precipitation Precipitation for October varied across the region. Above-normal precipitation was observed across Wyoming and stretched into the Dakotas. The largest departures from normal occurred in the Dakotas, eastern Nebraska, and eastern Kansas with totals as much as 4.5 inches (114 mm) above normal. This large area of above-normal precipitation led to many locations ranking in the top 10 wettest on record for October, many were in the Dakotas (see page 6 for monthly rankings). Huron, SD observed 5.22 inches (133 mm) for the month which ranked as the 3rd wettest October on record, with the record of 6.44 inches (164 mm) being set in 1946. This was 268 percent above the normal precipitation for October. The wetness during the month of October brought both snowstorms and tornadoes to South Dakota. To the west, in Rapid City, blowing snow due to high winds created low visibility, which resulted in highway closures for the duration of the storm. As the storm progressed, several tornadoes were reported in the northeastern corner of the state. Areas in Wyoming also observed above-normal precipitation for October. Casper, WY recorded 2.69 inches (68 mm) of precipitation which ranked as the 4th wettest October on record, the record being 4.62 inches (117 mm) set in 1998. This precipitation was 226 percent above normal for Casper. Lander, WY, which observed 255 percent of its normal precipitation for October, reported their 9th wettest October on record with 3.57 inches (91 mm) of precipitation. Despite the wetness in the northern and eastern parts of the High Plains, dryness was present in a large portion of the region. Eastern Colorado and the western parts of Kansas and Nebraska experienced below-normal precipitation for the month, with large swathes of 50 percent or below-normal precipitation. Denver, CO recorded the 8th driest October, with only 0.08 inches (2 mm) of precipitation. The dryness within this area has impacted agriculture. According to the USDA’s Weekly Weather and Crop Bulletin, pasture and rangelands that were rated as poor to very poor conditions were covering above 25 percent of the area for Colorado, Kansas, and Nebraska. Corn harvest was also ahead of the 5-year average for all states in the High Plains.
- First Snow for the High Plains Snow made its first appearance for many portions of the region in October. Cooler fall temperatures and above-normal precipitation in Wyoming, The Dakotas, and the higher elevations in Colorado contributed to the appearance of the season’s first significant snowfall. Southeastern Wyoming had its first Winter Storm and High Wind event of the season. High winds of 40 to 50 mph (64 to 80 km/h) coupled with snowfall led to the first Blizzard warnings being issued this season for counties in southeastern Wyoming. Highway closures, due to the blizzard, resulted in major travel issues. Travel alerts did not appear on some phones, so motorists were not aware of the closures and were stranded in towns along the interstate. Some motorists had to sleep in their cars as limited hotels in small towns were full and they could not get to other areas with the road closures. While this storm created major travel headaches, it did bring much-needed relief to neighboring wildfires, as well as the hot temperatures from summer, while also helping to improve air quality in the region. The Colorado Rockies also received their first notable snowfall of the season. Multiple snowstorms impacted the region in October bringing over a foot of snow in different areas. Winter Storm Warnings were issued for the higher elevations and stretched north to south across the entire range in Colorado. After a storm that brought 14 inches (356 mm) of snow to the southwest part of the state, Wolf Creek ski area near Pagosa Springs became the first in Colorado to open for the season. This was quickly followed by multiple other resorts releasing their opening dates bringing an early start to the ski season. After a summer filled with extreme heat and drought, many areas welcomed the relief of colder temperatures and snow. While drought is still present in the High Plains, this above-normal precipitation and snow did help to provide minor improvement across Wyoming, The Dakotas, and areas in Colorado.
Southern Region (Information provided by the Southern Regional Climate Center)
October was unusually warm across the Southern Region, with several severe weather outbreaks.
- Temperature October 2021 was a very warm month throughout the Southern Region, ranking 5th warmest in 127 years of records with an average temperature of 68.8 °F (20.4 °C). Every state was among the top ten historically except for Oklahoma, which was only 13th warmest all-time at 64.8 °F (18.2 °C). The highest-ranking state was Louisiana, 4th warmest all-time with an average October temperature of 72.4 °F (22.4 °C). One record high monthly temperature was set at a long-term station: 104 °F (40.0 °C) at Cotulla, southern Texas, on October 10, breaking a record set precisely one year earlier. The highest temperature of the month was at Rio Grande Village, southwestern Texas, on October 11, at 106 °F (41.1 °C). The lowest temperatures were observed in Tennessee (Mt. Leconte, October 18) and Texas (Muleshoe National Wildlife Refuge, Muleshoe 19 S, both October 16, and Cope Ranch, October 30), all at 25 °F (-3.9 °C). Arkansas, Louisiana, and Mississippi all avoided temperatures below 32 °F (0 °C) in October.
- Precipitation The monthly rainfall across the Southern Region tended to be on the wet side. Average precipitation in Tennessee was greatest, at 4.92 inches (125 mm), ranking 22nd wettest all-time. Oklahoma ranked 33rd at 3.93 inches (33rd wettest) and Arkansas ranked 45th at 4.29 inches (109 mm). The only state below the historical median was Louisiana, 49th driest at 2.50 inches (64 mm). The six-state region as a whole averaged 3.07 inches (78 mm), ranking 51st. The largest monthly rainfall total was 15.45 inches (392 mm) at Seminole, Oklahoma. Meanwhile, about a dozen stations in western Texas failed to record measurable precipitation.
- Drought From September 28 to November 2, the portion of the six-state Southern Region in drought expanded from nearly 14% to nearly 23%. The largest drought expansion was in Texas, which went from 7% in drought to 33% in drought. The neighboring state of Oklahoma saw drought extent shrink dramatically, from 73% to 37%. There were modest expansions of drought in Arkansas and Louisiana as well. The largest worsening of conditions were in the four-state region surrounding Texarkana and in west-central and southwestern Texas, with primary concerns associated with wildfire risk and establishment of cool-season forage.
- Heavy Rain There were several individual rainfall events that produced substantial one-day totals. Among the significant one-day precipitation amounts were 10.72 inches (272 mm) near Brownsville, southern Texas, on October 1-2; 8.15 inches (207 mm) in North Little Rock, Arkansas, on October 2-3; 8.10 inches (206 mm) at Fall Creek Falls State Park, Tennessee, on October 6-7; and 9.90 inches (251 mm) in Gonzales, southern Texas, on October 13-14. The heavy rainfall during October 1-3 was partly associated with the remnants of Hurricane Pamela, an eastern Pacific storm that made landfall earlier on the Mexican coast. Heavy rain in the San Antonio area associated with the same system caused two fatalities as a mother and her child were swept away in their vehicle.
- Severe Weather October saw considerable severe weather, with the traditional Tornado Alley region of northern Texas and Oklahoma being particularly active. The most significant severe weather outbreaks were October 10, 12, 26, and 27. The October 27 outbreak produced the strongest tornadoes, with two EF2 tornadoes in southeast Texas and one in Lake Charles, Louisiana that caused two injuries. An EF1 tornado in Pascagoula, Mississippi, caused one fatality as the driver of an SUV lost control and was ejected from his vehicle. There were 124 severe wind reports, including one measurement of 96 mph winds in the Big Bend area of Texas on October 26. The 33 hail reports included one report of 3” (8 cm) diameter hail near Norman, Oklahoma on October 10. Texas and Oklahoma received the bulk of the severe weather, but there were at least two tornadoes in each of the other four states in the region.
- For more information, please visit the Southern Regional Climate Center Home Page.
Western Region (Information provided by the Western Region Climate Center)
- The first week of October brought relatively quiet weather to the West with storminess increasing after that. The Pacific Northwest, central and northern California, and Great Basin saw above normal precipitation. The footprint of a strong, inland penetrating atmospheric river that occurred during the end of the month is evident in northern California and the Great Basin with a large area of greater than 200% of normal precipitation. The southern tier of California, Arizona, and New Mexico along with central Montana saw below normal precipitation. Below normal temperatures were found in California, Nevada, Utah, Arizona, western Oregon, and western Washington and above normal temperatures were found in Montana and eastern New Mexico.
- A series of atmospheric rivers began impacting the West coast and Great Basin around mid-month with the strongest one occurring October 24-26. This last event, driven by a rapidly intensifying bomb cyclone in the northeast Pacific, contributed to record breaking October total precipitation and some all time 24-hour precipitation records were also set. Monthly precipitation records were set at Stockton, California with 3.86 in (98 mm; 559% of normal), Tahoe City, California with 9.86 in (250 mm; 522% of normal), Reno, Nevada with 3.14 in (80 mm; 628% of normal), and Winnemucca, Nevada with 2.93 in (74 mm; 444% of normal). A new 24-hour precipitation record of 5.45 in (138 mm) was set on October 24 at Sacramento, California breaking the previous record of 5.28 in (134 mm) that was set in 1880. The storm track did not extend to southern tier of the West with part of southern California, Arizona, and New Mexico receiving less than 25% of normal precipitation for the month.
- With broad areas of low pressure dominating the west for much of the month temperatures were below normal throughout the region. Temperature anomalies of 2-4 °F below normal were found in parts of Oregon, California, Nevada, Utah, and Arizona. While these cold temperatures were not record breaking there were some areas that saw monthly mean temperatures in the bottom 10% of readings since 1895. Stockton, California saw the 5th coldest October since 1948 at 61.6 °F (16.5 °C), -3.9 °F (-2.1 °C) below normal. One area that was warm and dry for the month was southeast New Mexico. At Roswell, New Mexico the monthly mean temperature was 65.6 °F (18.7 °C) and +2.4 °F (+1.4 °C) above normal making it the third warmest since records began in 1949.
- Long-term drought remains entrenched in the West. Parts of every western state were in drought at the end of the month with 91% of the region in at least moderate drought (D1) according to the US Drought Monitor. While the strong atmospheric river that impacted the west coast was beneficial for short-term drought relief, the single event was not nearly enough to erase the long-term drought conditions that developed over the course of two or more years.
- In Alaska, parts of the central/northern Interior saw above normal temperatures and much of the western part of the state saw below normal temperatures. Bettles, just south of the Brooks Range, was, relatively speaking, one of the warmer parts of the state coming in at 27.5 °F (-2.5 °C) and +6.2 °F (+3.4 °C) above normal making it the 5th warmest on record. Parts of south-central Alaska saw well above normal precipitation that was recording breaking in some cases. An extreme precipitation event during the last few days of the month impacted the Chugach mountains. Alyeska recorded 9.53 in (242 mm) on October 31 making it the wettest 24-hour period on record (since 1964); the monthly total was also the wettest on record at 19.58 in (497 mm; 252% of normal).
- Precipitation was well below normal across the Hawaiian Islands with the exception being the windward side of the Big Island. Honolulu saw its driest October on record with just 0.05 in (1.27 mm; 3% of normal) and Molokai logged 0.21 in (5 mm) at 14% of normal. Dryness has been persistent for months over Maui, Lani, and Molokai with severe drought (D3) present on these islands at the end of the month.
- Significant Events for October 2021
- Multiple atmospheric rivers (ARs) make landfall along West coast October 19-26: The first two events produced AR 4 (extreme on the AR scale) conditions in southwest Oregon. The third and strongest event produced AR 5 (exceptional; highest on scale) conditions over central California with maximum observed integrated vapor transport values greater than 1000 kg m−1 s−1. Flooding, landslides, downed trees, and power outages were observed throughout the region. Despite more than 15 in (381 mm) of precipitation for some areas, major reservoir storage in the region is still below normal due to dry conditions over the past two years. Lake Oroville, California’s second largest reservoir, gained over 150,000 acre-feet of storage in just three days bringing the reservoir up to 54% of average (28% of capacity) by the end of the month. Folsom Lake, south of Oroville on the west slope of the Sierra, improved to 75% of average storage by the end of the month.