Summary Information
The Monthly Report Summary Information is a synopsis of the collection of national and global summaries released each month.
« Global Summary Information 2016Full Report »
Global Summary Information for March 2016
For 11th straight month, globe was record warm
Global highlights: March 2016
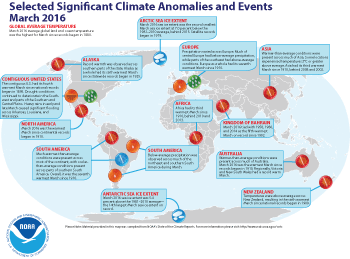
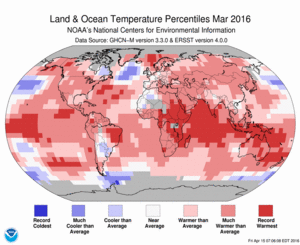
- The March average temperature across global land and ocean surfaces was 2.20°F above the 20th century average of 54.9°F. This was the highest for March in the 1880–2016 record, surpassing the previous record set in 2015 by 0.54°F. March 2016 was also the highest monthly temperature departure among all months on record, at 0.02°F higher than the previous record set just last month. This also marks the 11th consecutive month a monthly global temperature record has been broken, the longest such streak in the 137-year record.
- The March globally-averaged land surface temperature was 4.19°F above the 20th century average. This was the highest for March in the 1880–2016 record, surpassing the previous record set in 2008 by 0.77°F.
- El Niño conditions continued to weaken in the central and eastern Pacific Ocean during March. However, the March globally averaged sea surface temperature remained 1.46&ndeg;F above the 20th century monthly average, similar to February. This was the highest global ocean temperature for March in the 1880–2016 record, surpassing the previous record set in 2015 by 0.32–F and tying as the sixth highest departure from average among all 1,635 months in the record. Record high sea surface temperatures across most of the North Indian Ocean, along with parts of the central equatorial and southwest Pacific contributed to the March warmth. The six highest monthly global ocean temperature departures have all occurred in the past six months.
- The March temperature for the lower troposphere (roughly the lowest 5 miles of the atmosphere) was the highest in the 1979–2016 record, at 1.53°F above the 1981–2010 average, as analyzed by the University of Alabama in Huntsville (UAH) using version 5.6. It was also highest on record, at 1.33°F above the 1981–2010 average, as analyzed by Remote Sensing Systems (RSS).
- The March temperature for the mid-troposphere (roughly 2 miles to 6 miles above the surface) was the highest for this month in the 1979–2016 record, at 1.26°F above the 1981–2010 average, as analyzed by UAH. It was also highest on record, at 1.17°F above the 1981–2010 average, as analyzed by RSS. After removing the influence of temperatures above 6 miles in altitude, the University of Washington, using data analyzed by the UAH and RSS, calculated temperature departures from the 1981–2010 average to be 1.48°F and 1.37°F, respectively, both highest in the record.
- The average Arctic sea ice extent for March was 420,000 square miles (7.02 percent) below the 1981–2010 average. This was the second smallest March extent since records began in 1979 and 15,000 square miles larger than the record set just last year. On March 24th, Arctic sea ice reached its maximum extent for the year at 5.61 million square miles, the lowest annual maximum extent in the satellite record. The maximum extent was 431,000 square miles below average and 5,000 square miles below the previous record that occurred in 2015, according to analysis by the National Snow and Ice Data Center based on data from NOAA and NASA.
- Following its sixth smallest Antarctic sea ice extent in February, March sea ice extent for the region rebounded to 100,000 square miles (5.44 percent) above the 1981–2010 average. This was the 14th largest Antarctic sea ice extent in the 38-year period of record but the smallest since 2011. This continues the trend of substantial interannual variability for Antarctic sea ice.
- According to data from NOAA analyzed by the Rutgers Global Snow Lab, the Northern Hemisphere snow cover extent during March was 1.14 million square miles below the 1981–2010 average. This was the second smallest March Northern Hemisphere snow cover extent in the 50-year period of record and smallest since 1990. The North American snow cover extent was the third smallest on record while the Eurasian snow cover extent was fifth smallest.
*-This number was originally reported as 1,644
Global highlights: Year-to-date (January–March 2016)
- The year-to-date temperature across global land and ocean surfaces was 2.07°F above the 20th century average. This was the highest for January–March in the 1880–2016 record, surpassing the previous record set in 2015 by 0.50°F.
- The year-to-date globally averaged land surface temperature was 3.69°F above the 20th century average. This was the highest for January–March in the 1880–2016 record, surpassing the previous record of 2015 by 0.85°F.
- The year-to-date globally-averaged sea surface temperature was 1.48°F above the 20th century average. This was the highest for January&ndashy;March in the 1880–2016 record, surpassing the previous records of 2010 and 2015 by 0.38°F and surpassing January–March 1998, the last time a similar strength El Niño occurred, by 0.49°F.
For extended analysis of global temperature and precipitation patterns, please see our full March report
 NOAA's National Centers for Environmental Information


