Summary Information
The Monthly Report Summary Information is a synopsis of the collection of national and global summaries released each month.
« Global Summary Information 2016Full Report »
Global Summary Information for June 2016
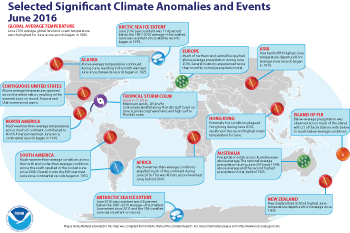
June marks 14th consecutive months of record heat for the globe
Global highlights: June 2016
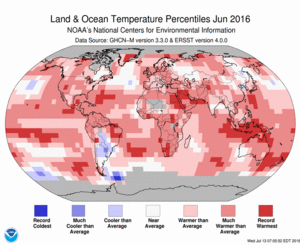
- The June temperature across global land and ocean surfaces was 1.62°F above the 20th century average of 59.9°F. This was the highest for June in the 1880–2016 record, surpassing the previous record set in 2015 by 0.04°F. June 2016 marks the 40th consecutive June with temperatures at least nominally above the 20th century average. June 1976 was the last time June global land and ocean temperatures were below average. June 2016 tied with March 2015 as the ninth highest monthly temperature departure among all months (1,638) on record. Overall, 14 of the 15 highest monthly temperature departures in the record have all occurred since February 2015, with January 2007 representing the one month prior to February 2015.
- The June globally averaged land surface temperature was 2.23°F above the 20th century average of 55.9°F. This value tied with 2015 as the highest June global land temperature in the 1880–2016 record. This was the 34th consecutive June with global land temperatures above the 20th century average.
- The June globally averaged sea surface temperature was 1.39°F above the 20th century monthly average of 61.5°F—the highest global ocean temperature for June in the 1880–2016 record, surpassing the previous record set in 2015 by 0.05°F. June 2016 was the 10th highest departure from average among all 1,638 months in the record. June 2016 marks the 40th consecutive June with global ocean temperatures above the 20th century average. Much warmer-than-average temperatures engulfed most of the world's oceans during June 2016, with record high sea surface temperatures across parts of the central and southwest Pacific Ocean, northwestern and southwestern Atlantic Ocean, and across parts of the northeastern Indian Ocean. The 12 highest monthly global ocean temperature departures have all occurred in the past 12 months.
- The June temperature for the lower troposphere (roughly the lowest 5 miles of the atmosphere) was the third highest in the 1979–2016 record, at 0.67°F above the 1981–2010 average, as analyzed by the University of Alabama in Huntsville* (UAH) using UAH version 5.6. It was also third highest on record, at 0.72°F above the 1981–2010 average, as analyzed by Remote Sensing Systems* (RSS). Both analyses rank June 1998 as the warmest June in the satellite record.
- The June temperature for the mid-troposphere (roughly 2 miles to 6 miles above the surface) was the fifth highest for June in the 1979–2016 record, at 0.50°F above the 1981–2010 average, as analyzed by UAH. It was fifth highest on record, at 0.49°F above the 1981-2010 average, as analyzed by RSS. After removing the influence of temperatures above 6 miles in altitude, the University of Washington, using data analyzed by the UAH and RSS, calculated temperature departures from the 1981–2010 average to be 0.67°F and 0.65°F, respectively, both fourth highest in the record. All analyses rank June 1998 as the warmest June in the satellite record.
- The average Arctic sea ice extent for June was 530,000 square miles (11.4 percent) below the 1981–2010 average. This was the smallest June extent since records began in 1979 and 100,000 square miles smaller than the previous record set in 2010. According to an analysis by the National Snow and Ice Data Center based on data from NOAA and NASA, sea ice cover was below average in the Kara, Barents, and Beaufort Seas. June Arctic sea ice extent is decreasing at an average rate of 3.6 percent per decade.
- The Antarctic sea ice extent for June was 40,000 square miles below the 1981–2010 average. This was the smallest June Antarctic sea ice extent since 2011 and the 13th smallest on record. June Antarctic sea ice extent is increasing at an average rate of 1.7 percent per decade.
Global highlights: Year-to-date (January–June 2016)
- The year-to-date temperature across global land and ocean surfaces was 1.89°F above the 20th century average of 56.3°F. This was the highest for January-June in the 1880–2016 record, surpassing the previous record set in 2015 by 0.36°F.
- The year-to-date globally averaged land surface temperature was 3.17°F above the 20th century average of 45.0°F. This was the highest for January-June in the 1880–2016 record, exceeding the previous record of 2015 by 0.70°F.
- The year-to-date globally averaged sea surface temperature was 1.42°F above the 20th century average of 60.9°F. This was the highest for January-June in the 1880–2016 record, besting the previous record of 2015 by 0.25°F.
- The January-June temperature for the lower troposphere was the highest in the 1979–2016 record, at 1.22°F above the 1981–2010 average, as analyzed by the University of Alabama in Huntsville* (UAH) using version 5.6. It was also highest on record, at 1.10°F above the 1981–2010 average, as analyzed by Remote Sensing Systems* (RSS).
- The January-June temperature for the mid-troposphere was the second highest for January-June in the 1979–2016 record, at 0.97°F above the 1981–2010 average, as analyzed by UAH. It was also second highest on record, at 0.94°F above the 1981–2010 average, as analyzed by RSS. After removing the influence of temperatures above 6 miles in altitude, the University of Washington, using data analyzed by the UAH and RSS, calculated temperature departures from the 1981–2010 average to be 1.21°F (highest on record) and 1.13°F (second highest on record behind 1998), respectively.
* Please note: the UAH and RSS datasets referenced in this report are versions that have completed a research-to-operations (R2O) transition involving scientific, technical and administrative processes designed to ensure operational reliability. Both groups have new versions of their products at some stage of the R2O process and will be incorporated in this report when the R2O process is complete.
For extended analysis of global temperature and precipitation patterns, please see our full June report
 NOAA's National Centers for Environmental Information


